This entry is part of a series dedicated to MIES – a miniature insurance economic simulator. The source code for the project is available on GitHub.
Current Status
Last week, I demonstrated the first simulation of MIES. Although it can run indefinitely without intervention on my part, I’ve made a lot of assumptions that aren’t particularly realistic – such as the ability of insureds to buy as much insurance as they wanted without any kind of constraint on affordability. I’ll address this today by implementing a budget constraint, a concept typically introduced during the first week of a second year economics course.
Most of the economic theory that I’ll be introducing to MIES for the time being comes from two books: Hal Varian’s Intermediate Microeconomics, a favorite of mine from school, and Zweifel and Eisen’s Insurance Economics, which at least according to the table of contents and what little I’ve read so far, seems to have much of the information I’d want to learn about for MIES.
I’m going to avoid repeating much of what can already be read in these books, so just an fyi, these are the sources I’m drawing from. My goals are to refresh my knowledge of economics as I read and then implement what I see in Python to add features to MIES.
The Economics Module
I’ve added a new module to the project, econtools.py. For now, this will contain the classes for exploring economics concepts with MIES, but seeing how much it has grown in just one week, it’s likely I’ll break it up in the near future. I’ll go over the first classes I’ve written for the module, those written for the budget constraint: Budget, Good, Tax, and Subsidy.
Budget Constraint
Those of you who have taken an economics course ought to find the following graph, a budget constraint, familiar:
As in the real world, there are only two goods that a person can possibly buy:
- Insurance
- Non-insurance
The budget constraint represents the set of possible allocations between insurance and non-insurance, aka all other goods. This can be represented by an equation as well:
![]()
Where each x represents the quantity of each good and each p represents the prices per unit for each good, and m represents income. People can only buy as much insurance as their incomes can support, hence the need for introducing this constraint into MIES for each person. The budget constraint simply shows that in order to buy one dollar more of insurance, you have to spend one dollar less on anything else that you were going to buy with your income.
The price of insurance is often thought of as a rate per unit of exposure, exposure being some kind of denominator to measure risk, such as miles driven, house-years, actuarial exams taken, or really anything you can think of that correlates with a risk that you’d like to charge money for.
Interestingly, there is nothing in the budget constraint as shown above that would prevent someone from insuring something twice or purchasing some odd products like a ‘lose-1-dollar-get-5-dollars back’ multiplier scheme. I’m not sure if these are legal or simply just discouraged by insurers as I’ve never tried to buy such a product myself or seen it advertised. I could imagine why insurers would not to sell these things – maybe due to the potential for fraud or the fact that an insured thing is 100% correlated with itself. On the other hand, a company might be able to compensate for these risks by simply charging more money to accept them. Regardless, if these products are really undesirable, I’d rather let the simulations demonstrate the impact of unrestricted product design than to have it constrained from the start. I’ll save that for another day.
The budget constraint is modeled with the Budget class in econtools.py. It accepts the goods to be allocated along with other relevant information, such as their prices and the income of the person for whom we are modeling the budget. You’ll see that the class contains references to the other component classes (Good, Tax, Subsidy) which are explained later:
|
1 2 3 4 5 6 7 8 9 10 11 12 13 14 15 16 17 18 19 20 21 22 23 24 25 26 27 28 29 30 31 32 33 34 35 36 37 38 39 40 41 42 43 44 45 46 47 48 49 50 51 52 53 54 55 56 57 58 59 60 61 62 63 64 65 66 67 68 69 70 71 72 73 74 75 76 77 78 79 80 81 82 83 84 85 86 87 88 89 90 91 92 93 94 95 96 97 98 99 100 101 102 103 104 105 106 107 108 109 110 111 112 113 114 115 116 117 118 119 120 121 122 123 124 125 126 127 128 129 130 131 132 133 134 135 136 137 138 |
class Budget: def __init__(self, good_x, good_y, income, name): self.good_x = good_x self.good_y = good_y self.income = income self.x_lim = self.income / (min(self.good_x.adjusted_price, self.good_x.price)) * 1.2 self.y_lim = self.income / (min(self.good_y.adjusted_price, self.good_y.price)) * 1.2 self.name = name def get_line(self): data = pd.DataFrame(columns=['x_values', 'y_values']) data['x_values'] = np.arange(int(min(self.x_lim, self.good_x.ration)) + 1) if self.good_x.tax: data['y_values'] = self.calculate_budget( good_x_price=self.good_x.price, good_y_price=self.good_y.price, good_x_adj_price=self.good_x.adjusted_price, good_y_adj_price=self.good_y.adjusted_price, m=self.income, modifier=self.good_x.tax, x_values=data['x_values'] ) elif self.good_x.subsidy: data['y_values'] = self.calculate_budget( good_x_price=self.good_x.price, good_y_price=self.good_y.price, good_x_adj_price=self.good_x.adjusted_price, good_y_adj_price=self.good_y.adjusted_price, m=self.income, modifier=self.good_x.subsidy, x_values=data['x_values'] ) else: data['y_values'] = (self.income / self.good_y.adjusted_price) - \ (self.good_x.adjusted_price / self.good_y.adjusted_price) * data['x_values'] return {'x': data['x_values'], 'y': data['y_values'], 'mode': 'lines', 'name': self.name} def calculate_budget( self, good_x_price, good_y_price, good_x_adj_price, good_y_adj_price, m, modifier, x_values ): y_int = m / good_y_price slope = -good_x_price / good_y_price adj_slope = -good_x_adj_price / good_y_adj_price base_lower = int(modifier.base[0]) base_upper = int(min(modifier.base[1], max(m / good_x_price, m / good_x_adj_price))) modifier_type = modifier.style def lump_sum(x): if x in range(modifier.amount + 1): x2 = y_int return x2 else: x2 = y_int + adj_slope * (x - modifier.amount) return x2 def no_or_all_adj(x): x2 = y_int + adj_slope * x return x2 def beg_adj(x): if x in range(base_lower, base_upper + 1): x2 = y_int + adj_slope * x return x2 else: x2 = y_int + slope * (x + (adj_slope/slope - 1) * base_upper) return x2 def mid_adj(x): if x in range(base_lower): x2 = y_int + slope * x return x2 elif x in range(base_lower, base_upper + 1): x2 = y_int + adj_slope * (x + (slope/adj_slope - 1) * (base_lower - 1)) return x2 else: x2 = y_int + slope * (x + (adj_slope/slope - 1) * (base_upper - base_lower + 1)) return x2 def end_adj(x): if x in range(base_lower): x2 = y_int + slope * x return x2 else: x2 = y_int + adj_slope * (x + (slope/adj_slope - 1) * (base_lower - 1)) print(x, x2) return x2 cases = { 'lump_sum': lump_sum, 'no_or_all': no_or_all_adj, 'beg_adj': beg_adj, 'mid_adj': mid_adj, 'end_adj': end_adj, } if modifier_type == 'lump_sum': option = 'lump_sum' elif modifier.base == [0, np.Inf]: option = 'no_or_all' elif (modifier.base[0] == 0) and (modifier.base[1] < max(m/good_x_price, m/good_x_adj_price)): option = 'beg_adj' elif (modifier.base[0] > 0) and (modifier.base[1] < max(m/good_x_price, m/good_x_adj_price)): option = 'mid_adj' else: option = 'end_adj' adj_func = cases[option] print(option) return x_values.apply(adj_func) def show_plot(self): fig = go.Figure(data=go.Scatter(self.get_line())) fig['layout'].update({ 'title': 'Budget Constraint', 'title_x': 0.5, 'xaxis': { 'range': [0, self.x_lim], 'title': 'Amount of ' + self.good_x.name }, 'yaxis': { 'range': [0, self.y_lim], 'title': 'Amount of ' + self.good_y.name }, 'showlegend': True }) plot(fig) |
Goods
The Good class represents things consumers can buy. We can set the price, as well as apply any taxes and subsidies:
|
1 2 3 4 5 6 7 8 9 10 11 12 13 14 15 16 17 18 19 20 21 22 23 24 25 26 27 28 29 30 31 32 33 34 35 36 37 38 |
class Good: def __init__( self, price, tax=None, subsidy=None, ration=None, name='Good', ): self.price = price self.tax = tax self.subsidy = subsidy self.adjusted_price = self.apply_tax(self.price) self.adjusted_price = self.apply_subsidy(self.adjusted_price) if ration is None: self.ration = np.Inf else: self.ration = ration self.name = name def apply_tax(self, price): if (self.tax is None) or (self.tax.style == 'lump_sum'): return price if self.tax.style == 'quantity': return price + self.tax.amount # else, assume ad valorem else: return price * (1 + self.tax.amount) def apply_subsidy(self, price): if (self.subsidy is None) or (self.subsidy.style == 'lump_sum'): return price if self.subsidy.style == 'quantity': return price - self.subsidy.value # else, assume ad valorem else: return price * (1 - self.subsidy.amount) |
Taxes
Taxes can be added to goods via the Tax class:
|
1 2 3 4 5 |
class Tax: def __init__(self, amount, style, base=None): self.amount = amount self.style = style self.base = base |
The tax class has three attributes, the amount, which specifies the amount of tax to be applied, style, which (for lack of a better word) specifies whether the tax is a quantity, value (or ad valorem) tax, or lump-sum tax. A quantity tax is a fixed amount of tax applied to each unit of a good purchased, a value tax is a tax that is proportional to the price of a good, and a lump-sum tax is a one-time tax paid for participating in the market for that good. Finally, the base attribute specifies over what quantities a tax applies (for example, a tax applied to the first 5 units purchased).
To demonstrate, we’ll add three different types of taxes to our insurance, first by specifying the tax details, and then adding them to the goods, we then specify the relevant budget constraints:
|
1 2 3 4 5 6 7 8 9 10 11 12 13 14 15 16 17 18 19 20 |
ad_valorem_tax = ec.Tax(amount=1, style='value', base=[0,np.Inf]) quantity_tax = ec.Tax(amount=4, style='quantity', base=[0, np.Inf]) all_other = ec.Good(price=1, name='All Other Goods') ad_valorem_first_two = ec.Tax(amount=1, style='value', base=[0, 2]) insurance_no_tax = ec.Good(price=1, name='Insurance') insurance_ad_valorem = ec.Good(price=1, tax=ad_valorem_tax, name='Insurance') insurance_value = ec.Good(price=1, tax=quantity_tax, name='Insurance') insurance_first_two = ec.Good(price=1, tax=ad_valorem_first_two, name='Insurance') budget_no_tax = ec.Budget(insurance_no_tax, all_other, income=10, name='No Tax') budget_ad_valorem = ec.Budget(insurance_ad_valorem, all_other, income=10, name='Ad Valorem Tax') budget_quantity = ec.Budget(insurance_value, all_other, income=10, name='Value Tax') budget_first_two = ec.Budget(insurance_first_two, all_other, income=10, name='Ad Valorem Tax - First 2') fig = go.Figure() fig.add_trace(go.Scatter(budget_no_tax.get_line())) fig.add_trace(go.Scatter(budget_ad_valorem.get_line())) fig.add_trace(go.Scatter(budget_quantity.get_line())) fig.add_trace(go.Scatter(budget_first_two.get_line())) |
We can now plot the resulting budget constraints on a single graph:
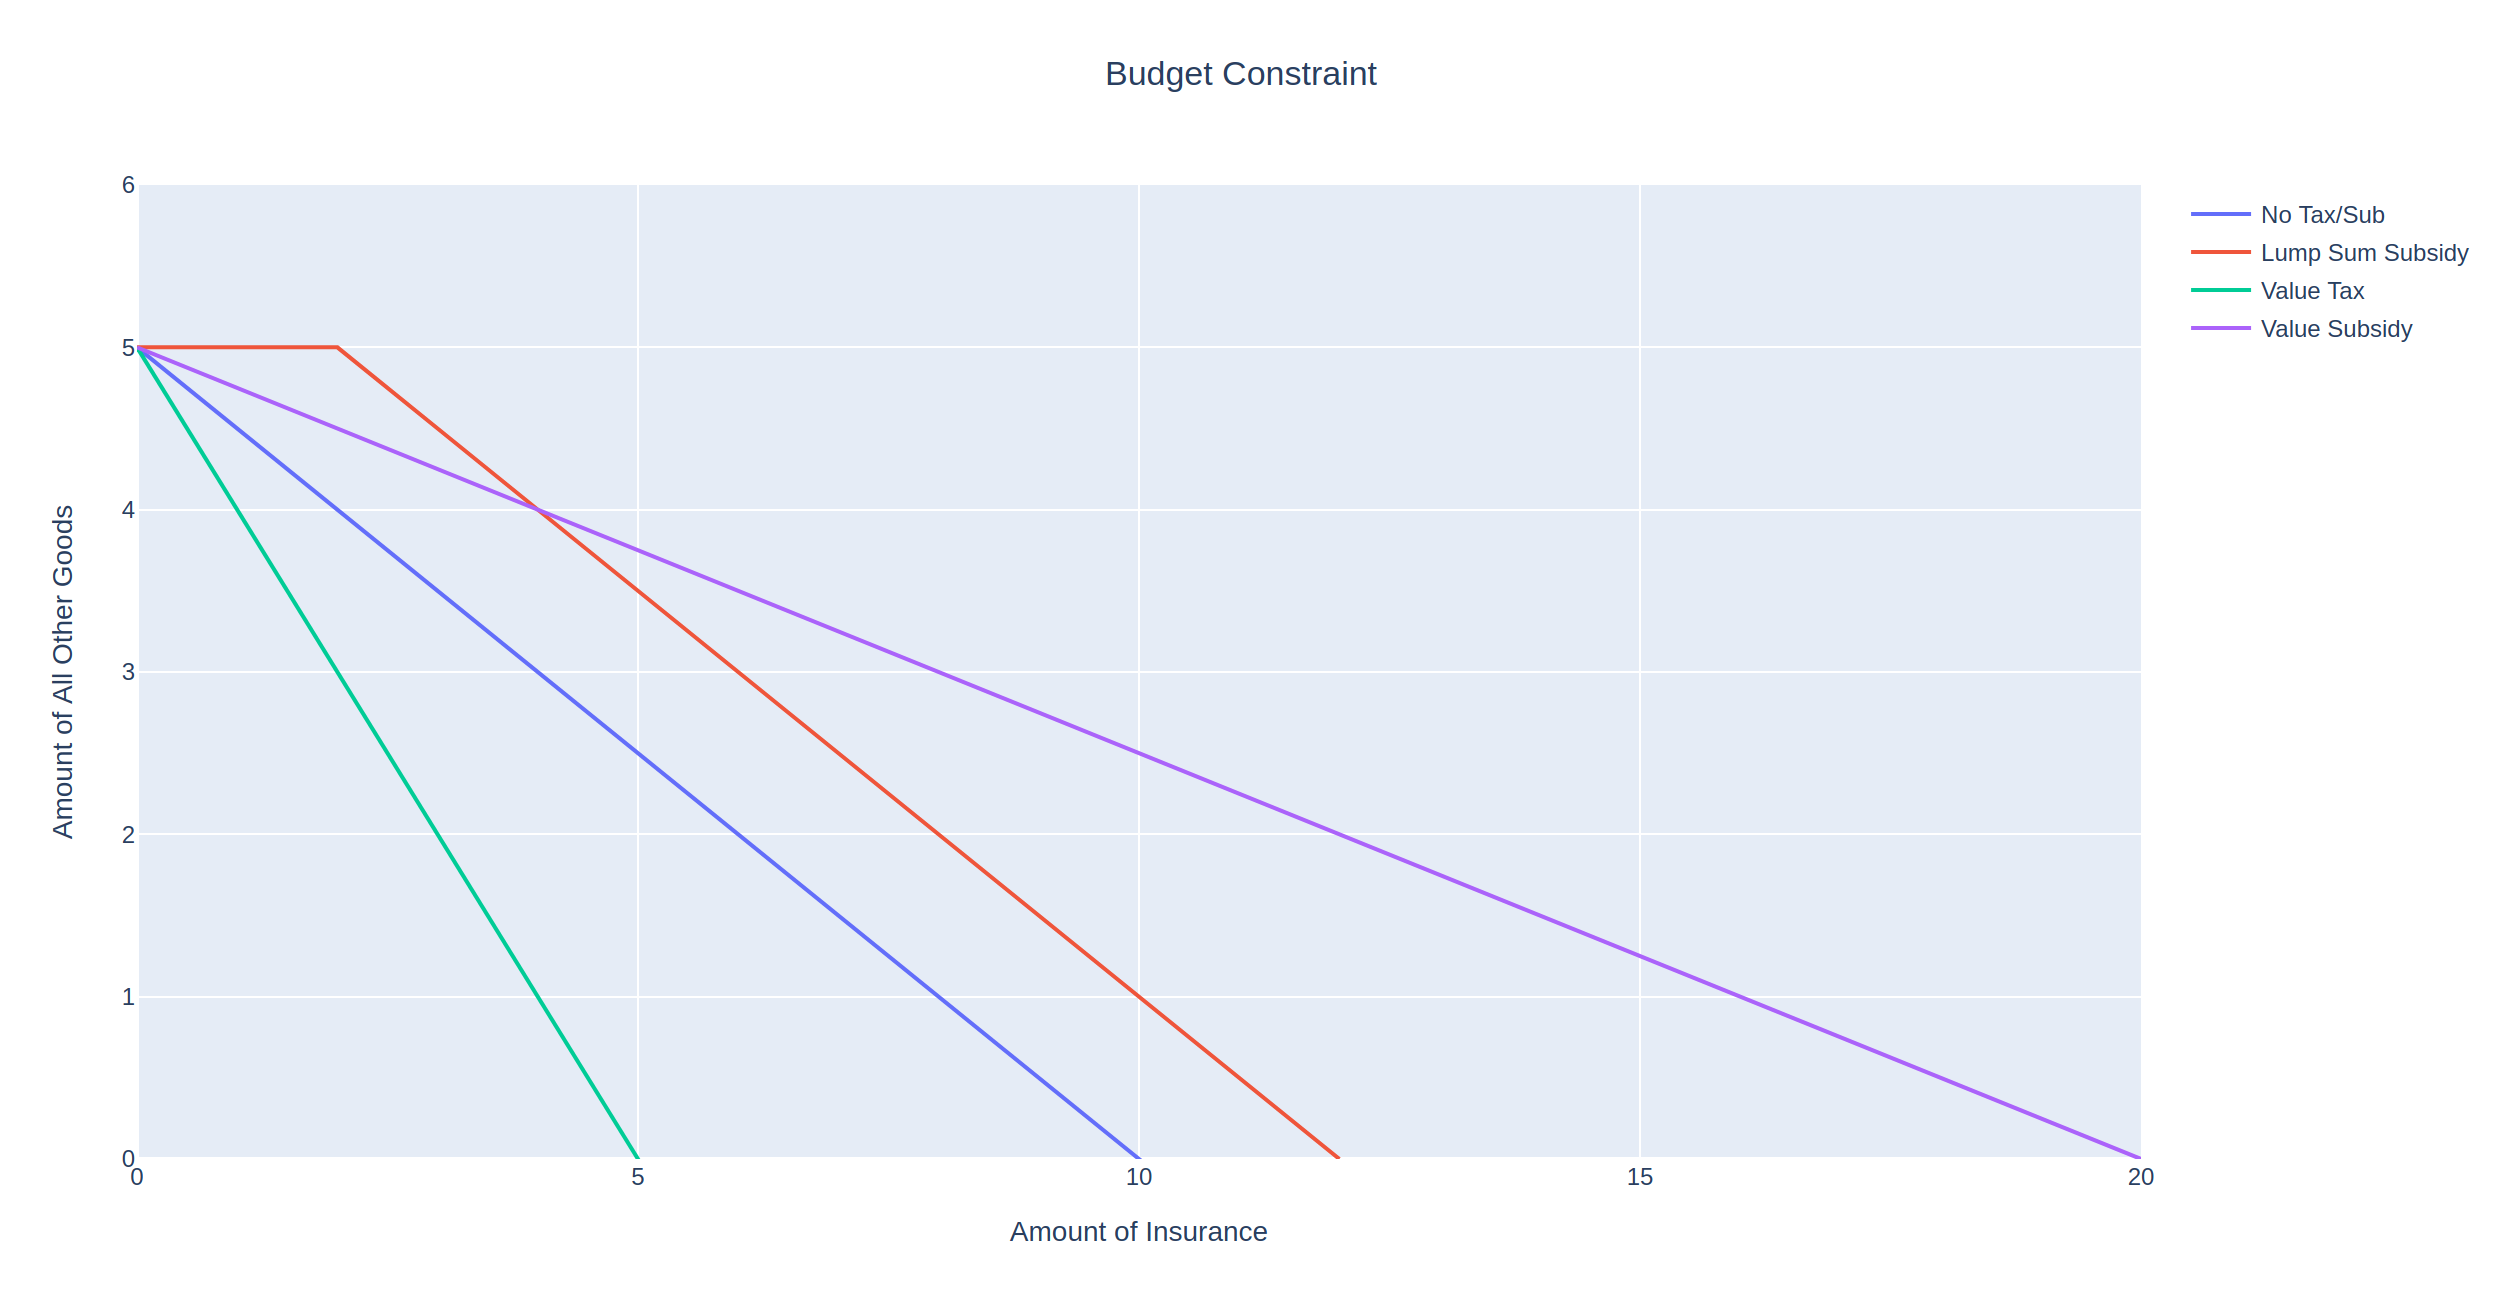
As expected, the no-tax scenario (blue line) allows the insured to purchase the most insurance, indicated by the x-intercept at 10. Contrast this with the most punitive tax, the value tax shown by the green line with an x-intercept at 2. In this scenario, we increase the price of each unit of insurance form 1 to 5, so that the insured can at most afford 2 units of insurance.
Between these two extremes are the two ad valorem taxes that double the price of insurance. However, the purple line is less punitive as it only taxes the first two units of insurance purchased.
Subsidies
Subsidies behave very similarly to taxes, so much so that I have considered either defining them as a single class or both inheriting from a superclass. Instead of penalizing the consumer, subsidies reward the consumer either by lowering the price of a good or by giving away free units of a good:
|
1 2 3 4 5 |
class Subsidy: def __init__(self, amount, style, base=None): self.amount = amount self.style = style self.base = base |
Just like with taxes, we can specify the subsidy amount, style, and quantities to which it applies. For instance, let’s suppose that as part of a risk-management initiative, the government grants 2 free units of insurance to a consumer in the form of a lump sum subsidy:
The subsidy has allowed the consumer to have at least 2 units of insurance without impacting the maximum amount of all other goods they can buy. We also see that the maximum amount of insurance the consumer can purchase has increased by the same amount, from 10 to 12.
MIES Integration
To integrate these classes and make use of the econtools.py module, I’ve made some changes to the existing MIES modules. In last week’s example, income was irrelevant for each person, and therefore they were unconstrained with respect to the amount of insurance they could purchase. Since a budget constraint is only relevant in the form of some kind of limited spending power, I’ve decided to introduce consumer income into MIES.
Income is now determined by a Pareto distribution, though certainly other distributions are possible and more realistic. In the parameters.py module, I’ve added a value of 30000 as the scale parameter for each person:
|
1 2 3 4 5 6 7 |
person_params = { 'age_class': ['Y', 'M', 'E'], 'profession': ['A', 'B', 'C'], 'health_status': ['P', 'F', 'G'], 'education_level': ['H', 'U', 'P'], 'income': 30000 } |
The person SQLite table has also been updated to accept income as a field:
|
1 2 3 4 5 6 7 8 9 10 11 12 13 14 15 16 17 18 19 20 21 22 23 24 25 26 27 28 29 30 31 32 33 34 35 36 |
class Person(Base): __tablename__ = 'person' person_id = Column( Integer, primary_key=True ) age_class = Column(String) profession = Column(String) health_status = Column(String) education_level = Column(String) income = Column(Float) policy = relationship( "Policy", back_populates="person" ) event = relationship( "Event", back_populates="person" ) def __repr__(self): return "<Person(" \ "age_class='%s', " \ "profession='%s', " \ "health_status='%s', " \ "education_level='%s'" \ "income='%s'" \ ")>" % ( self.age_class, self.profession, self.health_status, self.education_level, self.income ) |
And finally, I’ve added a method to the environment class to assign incomes to each person by drawing from the Pareto distribution using the scale parameter:
|
1 2 3 4 5 6 7 8 9 10 11 12 13 14 15 16 17 18 19 20 21 22 23 24 25 26 27 28 29 30 31 32 33 |
def make_population(self, n_people): age_class = pm.draw_ac(n_people) profession = pm.draw_prof(n_people) health_status = pm.draw_hs(n_people) education_level = pm.draw_el(n_people) income = pareto.rvs( b=1, scale=pm.person_params['income'], size=n_people, ) population = pd.DataFrame(list( zip( age_class, profession, health_status, education_level, income ) ), columns=[ 'age_class', 'profession', 'health_status', 'education_level', 'income' ]) population.to_sql( 'person', self.connection, index=False, if_exists='append' ) |
This results in a mean income of five figures with some high-earning individuals making a few million dollars per year. To examine the budget constraint for a single person in MIES, we can do so by running two iterations of the simulation and then querying the database:
|
1 2 3 4 5 6 7 8 9 10 11 12 13 14 15 16 17 18 19 20 21 22 23 24 25 26 27 28 29 30 31 32 33 34 35 36 37 38 39 40 |
import pandas as pd import datetime as dt import sqlalchemy as sa import econtools as ec from SQLite.schema import Person, Policy, Base, Company, Event from sqlalchemy.orm import sessionmaker from entities import God, Broker, Insurer import numpy as np import plotly.graph_objects as go from plotly.offline import plot pd.set_option('display.max_columns', None) engine = sa.create_engine('sqlite:///MIES_Lite.db', echo=True) Session = sessionmaker(bind=engine) Base.metadata.create_all(engine) gsession = Session() ahura = God(gsession, engine) ahura.make_population(1000) pricing_date = dt.date(1, 12, 31) rayon = Broker(gsession, engine) company_1 = Insurer(gsession, engine, 4000000, Company, 'company_1') company_1_formula = 'severity ~ age_class + profession + health_status + education_level' pricing_status = 'initial_pricing' free_business = rayon.identify_free_business(Person, Policy, pricing_date) companies = pd.read_sql(gsession.query(Company).statement, engine.connect()) rayon.place_business(free_business, companies, pricing_status, pricing_date, company_1) ahura.smite(Person, Policy, pricing_date + dt.timedelta(days=1)) company_1.price_book(Person, Policy, Event, company_1_formula) pricing_status = 'renewal_pricing' rayon.place_business(free_business, companies, pricing_status, pricing_date, company_1) |
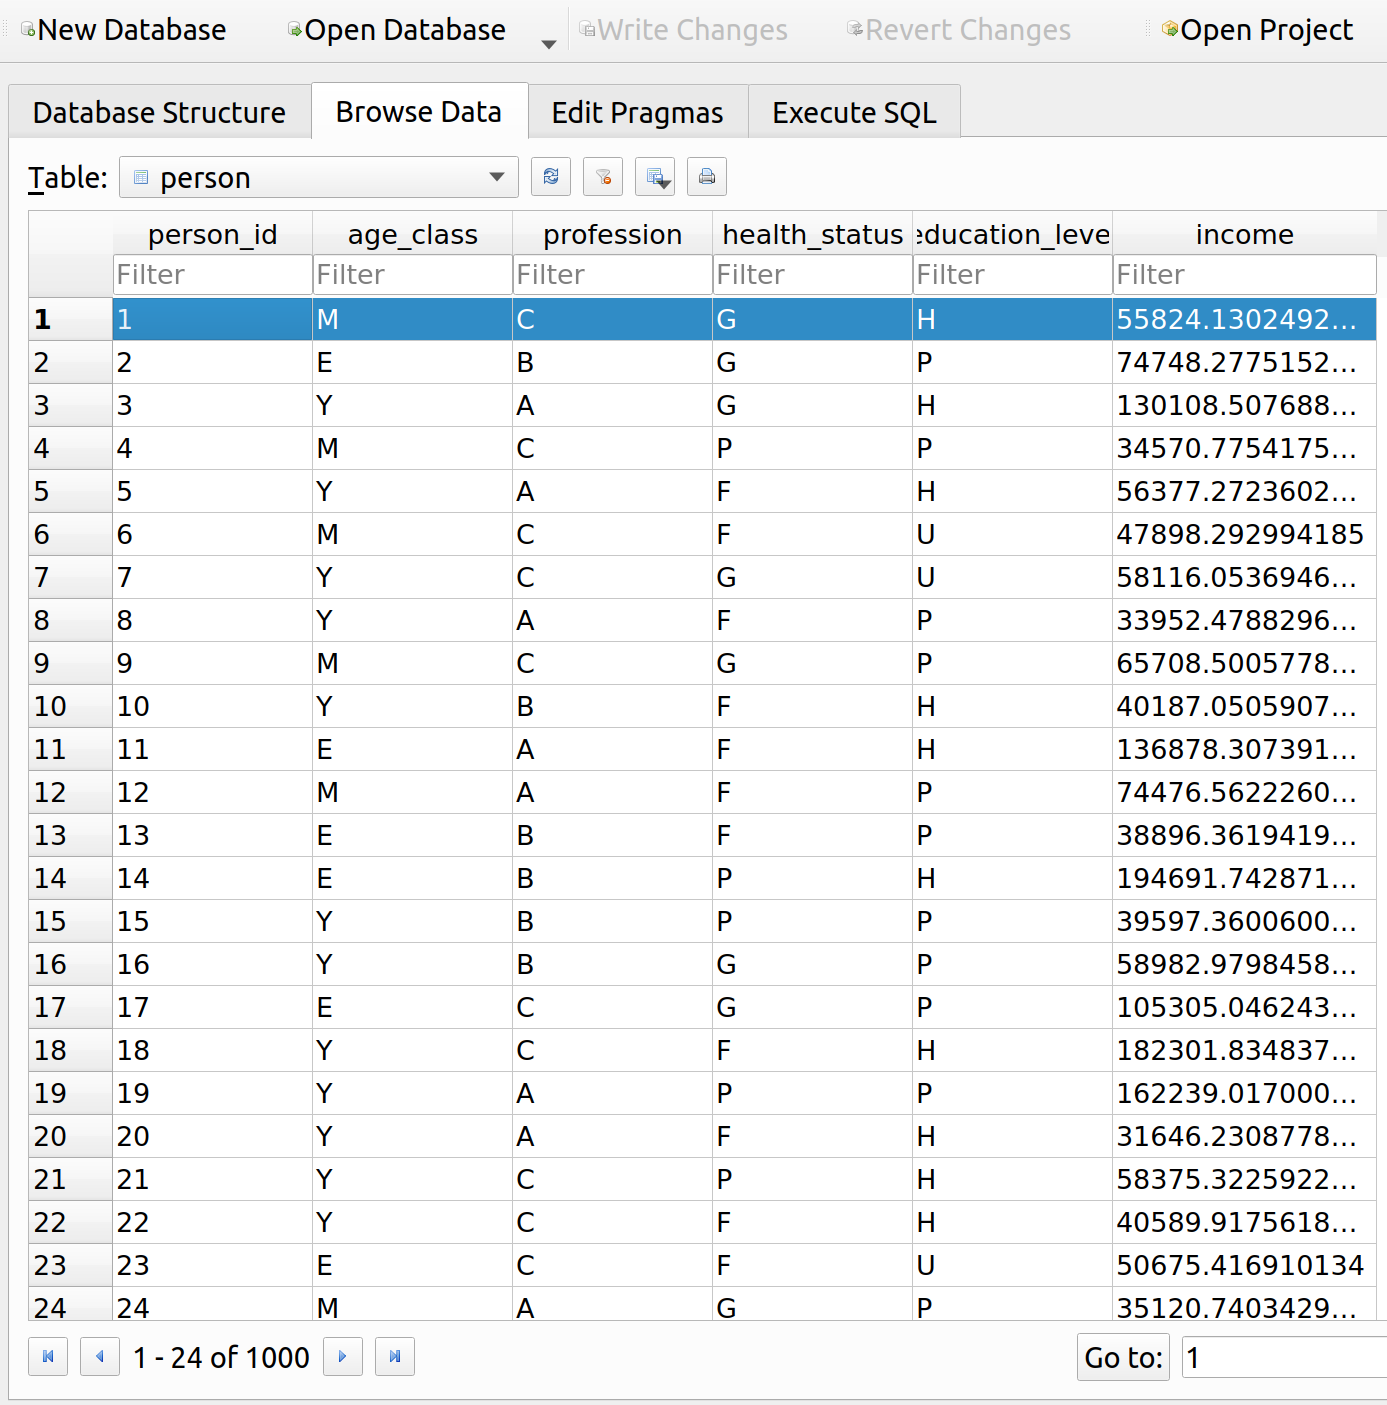
When we query the person table, we can see that the person we are interested in (id=1) has an income of about 56k per year:
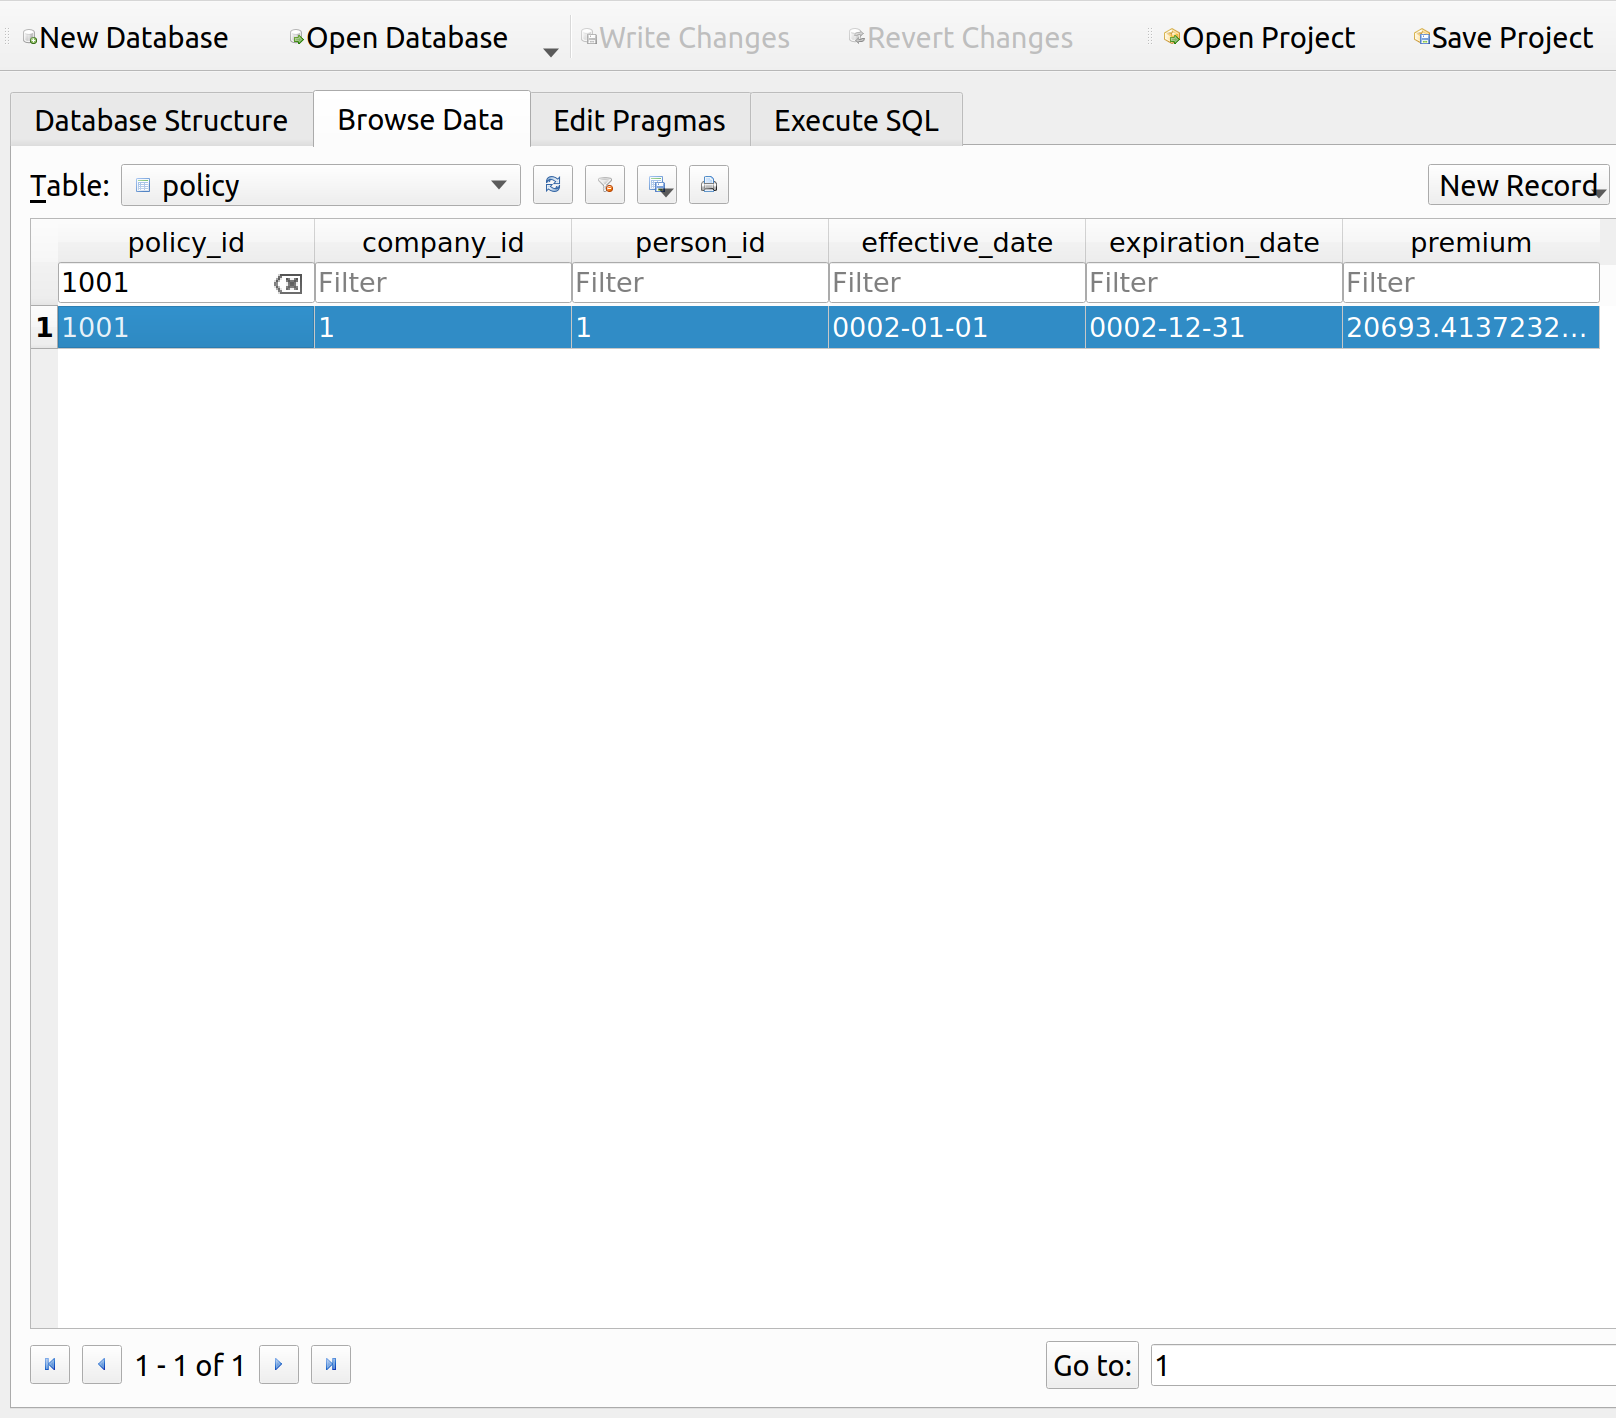
We can also see that their premium upon renewal was about 21k, almost half their income and much higher than the original premium of 4k:
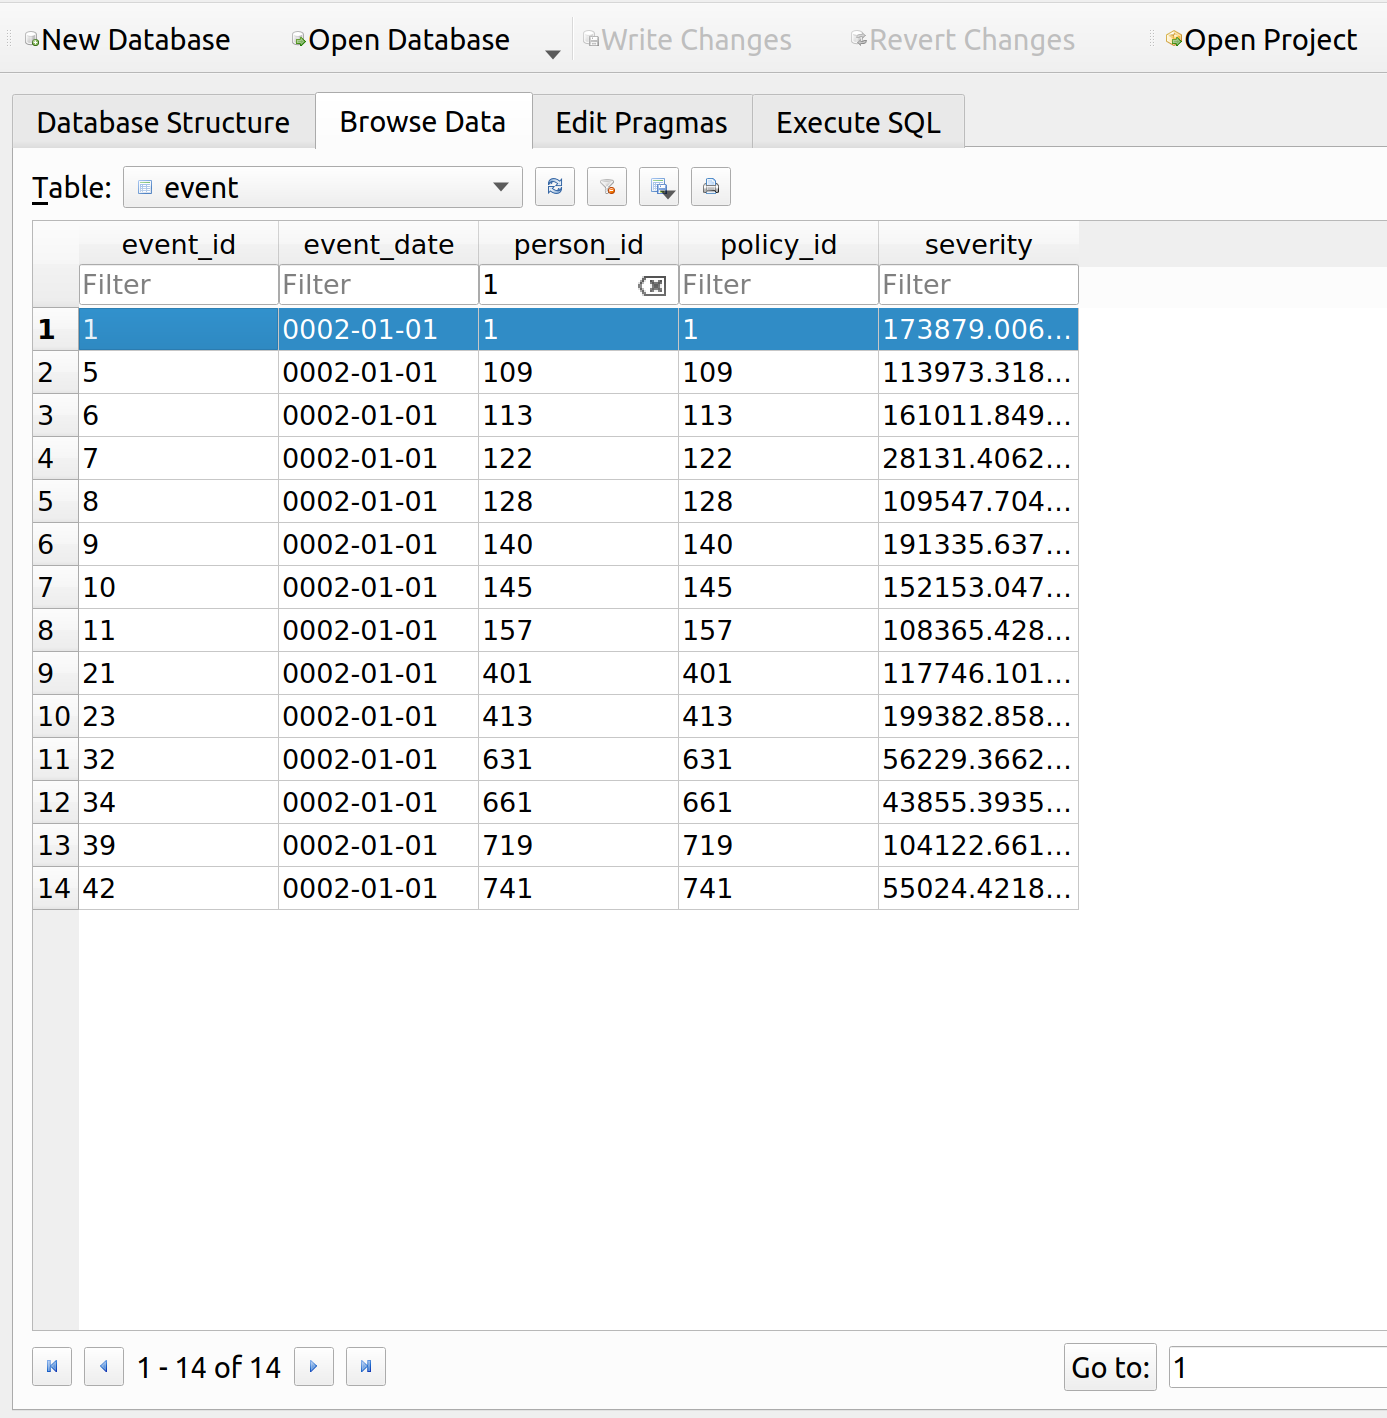
Let’s look at the events table to see why their premium is so high. It looks like they had a loss of about 174k, so the insurance up to this point has at least been worth their while:
We can now query the relevant information about this person, and use econtools.py to graph their budget constraint prior to and during renewal:
|
1 2 3 4 5 6 7 8 9 10 11 12 13 14 15 16 17 18 19 20 21 22 23 24 25 26 27 28 29 30 31 32 33 34 35 36 37 38 39 40 41 42 43 44 45 46 47 48 49 |
myquery = gsession.query(Person.person_id, Person.income, Policy.policy_id, Policy.premium).\ outerjoin(Policy, Person.person_id == Policy.person_id).\ filter(Person.person_id == str(1)).\ filter(Policy.policy_id == str(1001)) my_person = pd.read_sql(myquery.statement, engine.connect()) my_person all_other = ec.Good(price=1, name="All Other Goods") price = my_person['premium'].loc[0] id = my_person['person_id'].loc[0] income = my_person['income'].loc[0] renewal = ec.Good(price=price, name="Insurance") original = ec.Good(price=4000, name="Insurance") budget_original = ec.Budget(good_x=original, good_y=all_other, income=income, name='Orginal Budget') renewal_budget = ec.Budget(good_x=renewal, good_y=all_other, income=income, name='Renewal Budget') fig = go.Figure() fig.add_trace(go.Scatter(budget_original.get_line())) fig.add_trace(go.Scatter(renewal_budget.get_line())) fig['layout'].update({ 'title': 'Budget Constraint', 'title_x': 0.5, 'xaxis': { 'range': [0, 20], 'title': 'Amount of Insurance' }, 'yaxis': { 'range': [0, 60000], 'title': 'Amount of All Other Goods' }, 'showlegend': True, 'legend': { 'x': .71, 'y': 1 }, 'width': 590, 'height': 450, 'margin': { 'l':10 } }) fig.write_html('mies_budget.html', auto_open=True) |
This insured used to be able to afford about 14 units of insurance prior to their large claim. Upon renewal, their premium went up drastically which led to a big drop in affordability, as indicated by the red line. Now they can only afford a little more than 2 units of insurance.
Further Improvements
The concept of utility builds upon the budget constraint by answering the question – given a budget, what is the optimal allocation of goods one can purchase? I think this will be a bit harder and may take some time to program. As I’ve worked on this, I’ve found my programming stints to fall into three broad categories:
- Economic Theory
- Insurance Operations
- Refactoring
Every now and then after adding stuff to MIES, the code will get messy and the object dependencies more complex than they need to be, therefore, I ought to spend a week here or there just cleaning up the code. Sometimes I’ll stop to work on some practice problems to strengthen my theoretical knowledge, which I suspect I’ll need to do soon since I need a refresher on partial derivatives, which are used to find optimal consumption bundles.


Pingback: No. 137: MIES – Cobb-Douglas Utility | Gene Dan's Blog