• Home
  • Readings
  • Github
  • MIES
  • TmVal
  • About
Gene Dan's Blog

Monthly Archives: January 2013

You are browsing the site archives by month.

No. 81: A Brief Introduction to Sweave

22 January, 2013 3:08 AM / Leave a Comment / Gene Dan

Hey everyone,

I’ve been using RStudio more regularly at work, and last week I discovered a useful feature called Sweave that allows me to embed R code within a LaTeX document. As the PDF is being compiled, the R code is executed and the results are inserted into the document, creating publication-quality reports. To see what I mean, take a look at the following code:

[code language=”R”]documentclass{article}
usepackage{parskip}
begin{document}
SweaveOpts{concordance=TRUE}

Hello,\\
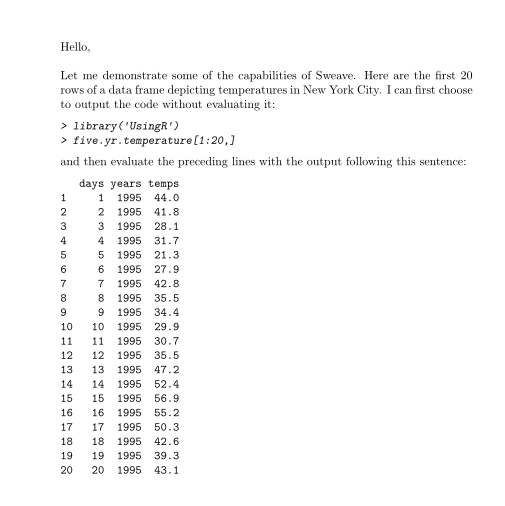
Let me demonstrate some of the capabilities of Sweave. Here are the first 20 rows of a data frame depicting temperatures in New York City. I can first choose to output the code without evaluating it:

<<eval=false>>=
library(‘UsingR’)
five.yr.temperature[1:20,]
@

and then evaluate the preceding lines with the output following this sentence:

<<echo=false>>=
library(‘UsingR’)
five.yr.temperature[1:20,]
@
end{document}

[/code]

After compilation, the resulting PDF looks like this:

sweave1View PDF

Within a Sweave document, the embedded R code is nested within sections called “code chunks”, the beginning of which are indicated with the characters $latex <<>>=$ , and the end of which are indicated with the character $latex @$. The above example contains two code chunks, one to print the R input onto the document without evaluating it, and the second to print the R output without printing the R input. This is achieved by using the options “eval=false” and “echo=true”. The option eval specifies whether or not the R code should be evaluated, and the option echo specifies whether the R input should be displayed onto the PDF.

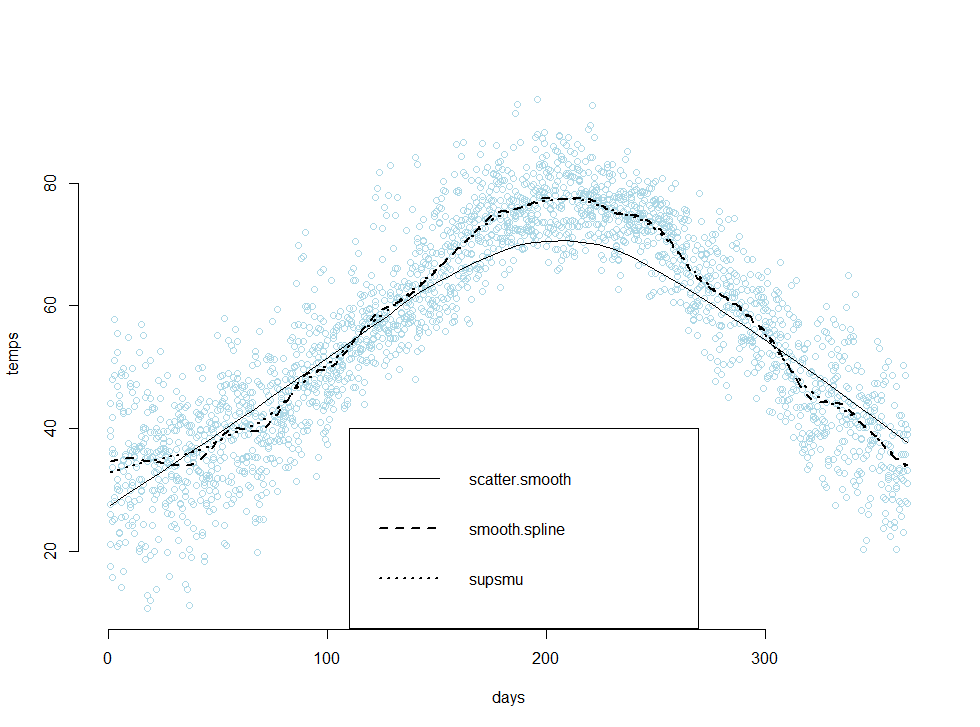
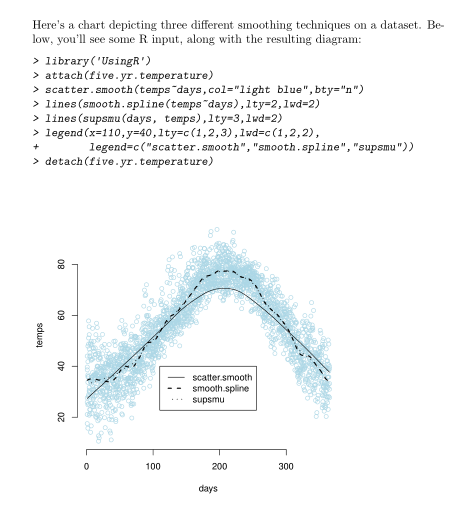
Sweave also has the capability to print graphics onto your PDF. The following example applies three different smoothing techniques to a dataset containing temperatures in New York City, and then plots the results in a scatter plot:

[code language=”R”]

documentclass{article}
usepackage{parskip}
begin{document}
SweaveOpts{concordance=TRUE}

Here’s a chart depicting three different smoothing techniques on a dataset. Below, you’ll see some R input, along with the resulting diagram:
<<fig=true>>=
library(‘UsingR’)
attach(five.yr.temperature)
scatter.smooth(temps~days,col=”light blue”,bty=”n”)
lines(smooth.spline(temps~days),lty=2,lwd=2)
lines(supsmu(days, temps),lty=3,lwd=2)
legend(x=110,y=40,lty=c(1,2,3),lwd=c(1,2,2),
legend=c(“scatter.smooth”,”smooth.spline”,”supsmu”))
detach(five.yr.temperature)
@

end{document}

[/code]

sweave2

View PDF

Pretty neat, right? I’d have to say that I’m extremely impressed with RStudio’s team, and their platform has made both R and LaTeX much more enjoyable for me to use. From the above examples, we can conclude that there are at least two benefits from using Sweave:

  1. There’s no need to save images, or copy and paste output into a separate file. Novice users of R would likely generate the R output in a separate instance of R, copy both the R input and output into a textfile, and then copy those pieces into a final report. This process is both time consuming and error prone.
  2. The R code is evaluated when the LaTeX document is compiled, and this means that both the R input and R output within the file report correspond to each other. This greatly reduces the frequency of errors, and increases the consistency of the code you see in the final report.

Because of this, I’ve found Sweave to be extremely useful on the job, especially in the documentation of code.

Additional Resources
The code examples that you see above use data provided from a book that I’m currently working through, Using R for Introductory Statistics. The book comes with its own package called ‘UsingR’ which contains several data sets that are used in its exercises. Sweave has an official instruction manual, which can be found on it’s official home page, here. I found the manual to be quite technical, and I believe it might also be difficult for people who are not thoroughly familiar with the workings of LaTeX. I believe the key to learning Sweave is to simply learn the noweb syntax and to experiment with adjusting the code-chunk options yourself.

noweb
An article on Sweave from RNews
A tutorial by Nicola Sartori
The Joy of Sweave by Mario Pineda-Krch
More links from UMN
An article from Revolution Analytics

sweave3

Posted in: Logs, Mathematics / Tagged: LaTeX, R, R LaTeX integration, RStudio, Statistics, Sweave

No. 80: Book Review – Excel & Access Integration

15 January, 2013 2:43 AM / Leave a Comment / Gene Dan

Hey everyone,

A couple months ago, I received a couple of Cyber Monday deals from O’Reilly and Apress offering 50% off all e-books. I couldn’t resist and I bought about 10 books, including a set of 5 called the “Data-Science Starter Kit” which includes tutorials on R and data analysis. One of the books I purchased was Alexander and Clark’s Excel & Access Integration, which covers basic connectivity between the two programs along with more advanced techniques such as VBA/SQL/ADO integration. Learning how to use the latter technique was the main reason I decided to purchase the book. We actuaries are well-versed in basic maths and finance, but when it comes to programming and database management, as a group we aren’t that strong. However, one of our strongest traits is being able to teach ourselves, and many of the most skilled programming actuaries I know are self-taught (actually, it is believed that most programmers in general are autodidacts).

Actuaries spend a good chunk of their time (possibly most) working with Excel and Access, and while most of them eventually become proficient with both softwares, very few become adept at integrating the two programs efficiently to make the best use of their time. Learning to do so takes a non-trivial investment of time and effort – first of all, being proficient with the interfaces of the two programs is a must. Second, the actuary must learn VBA to familiarize himself with the language’s objects, properties, and methods (and that’s if the actuary is already familiar with object-oriented programming). Third, the actuary must learn SQL to efficiently query tables. Finally, the actuary must learn ADO to simultaneously manipulate Excel and Access objects, and to be able to write SQL queries within the VBA environment.

To a junior actuary, this can be a daunting task. Not only must he keep up with the deadlines from his regular work, but he must also study mathematics for his credentialing exams. Fitting in additional IT coursework is a luxury. However, in my opinion it’s well worth the effort. By the time I purchased this book, I was on the 3rd step of the process I had mentioned earlier – I was learning SQL and slowly weaning myself away from the Design View in Access. I started reading the book at the beginning of this month and finished it last afternoon, and in timing myself I totaled about 21.5 hours over 374 pages. Here’s what I think:

Experts can skip to Chapter 8
exacThe first 7 chapters cover basic integration techniques using the Excel and Access GUIs, mostly through the ribbons of each program. Some of these techniques involve linking tables and queries, along with creating reports and basic macros in Access. Chapter 7 gives a brief introduction to VBA, but doesn’t go as in-depth as Walkenbach’s text (which is over 1000 pages long). In my opinion, these chapters are good for those looking for a refresher in the basics, but novices should look elsewhere as these chapters might not be detailed enough to give a comprehensive review of Excel and Access. On the other hand, experts looking for a quick introduction on ADO might find the first 7 chapters trivial, and should be able to start on chapter 8 without any trouble if they have an upcoming deadline to meet.

Chapter 8 is where the book really shines. I view ADO as the “missing piece” that analysts need to integrate these two programs. The example subroutines provided with the included files are clear, easy to understand, and come with plenty of comments that explain how each step works. The macros are ready to run, and you can see how it’s possible to say, create a subroutine that can output 50 queries into a report with no human intervention.

The last two chapters focus on XML and integrating Excel and Access with other Microsoft applications such as Word, PowerPoint, and Outlook. I don’t use these programs heavily, but the examples were straightforward and understandable.

Some Caveats

Not all of the examples work. I found that one of the provided tables was missing a field that I needed to run an example using MSQuery. Furthermore, some details within the provided files were inconsistent with what I read in the text. For instance, some of the subroutine names were different, along with the names and extensions of some files. The last thing I didn’t like about the book was the overuse of some buzzwords. However, this book is hardly the worst offender I’ve seen, and overall I’d rate it as an excellent book and a invaluable reference for any actuary’s library.

Posted in: Logs / Tagged: Access, ADO, automation, DAO, Excel, Excel & Access Integration, Geoffrey Clark, Michael Alexander, ODBC, queries, SQL, VBA

No. 79: First Post of 2013!

8 January, 2013 2:55 AM / Leave a Comment / Gene Dan

I’d like to start the new year with a few short updates:

-I ended up passing MFE back in November. I received a score of 8 (I’m assuming 9 was the highest possible score for my exam), which is one point lower than I would have liked, but nevertheless I’m happy to say that I’m finally done with the preliminary exams and halfway through with the CAS examination process. While I was waiting for my score, I also passed the CA1 module, which isn’t an ‘exam’ (even though it involves one), but one of two, month-long courses I have to take in addition to the exam requirements.

-I recently rotated into a new role at work. Instead of doing traditional reserving, I’ll be doing predictive modeling work full-time under a new supervisor. I had learned about the departmental changes after I took MFE. About a year ago, I began taking on additional responsibilities with modeling, and I’m glad to have been given the opportunity to specialize in this field. There will be a steep learning curve along the way, but I think I’ll gain valuable experience over the next couple of years.

-I didn’t manage to keep my resolution of posting 1 post per week last year. However, I managed to crank out 37 posts, which almost doubled the number of posts I had written from 2008-2011. I had steady updates until the last 3rd of the year when I stopped posting to devote time to courses MFE and CA1, but this year I’ll try my best to maintain the 1 post/week rate. I have some exciting projects that I’m currently working on, so I have a feeling I’ll easily surpass that goal.

-I installed some productivity tools in my browser to monitor the amount of time I spend on the internet. Towards the end of the year, I discovered that I sometimes wasted 6 hours in a single day due to unnecessary internet surfing on sites such as Facebook and Reddit. I also obsessively kept up with the news (ironically, in the past I had trouble keeping up with current events due to schoolwork), which oftentimes left me reading multiple articles over the same subject. I had dabbled with such browser plugins over the past couple of years, but removed them several times due to lack of discipline. This year I resolve to keep the current rules enforced for good. This year I’ve set a window from 9:00 PM to 10:00 PM devoted to social media, sports, news, and related websites (which also means I’ll have to plan my blog posts ahead of time so I can publish them within that window). At all other times during the day access will be blocked so that I can focus on doing my work, and learning the things I want to learn. I believe that strict observation of this rule will allow me to complete a lot more of my projects.

-I started studying for CAS Exam 5 this month. This gives me 4 months of solid study time for my first upper-level examination. At this point, the exams stop being math-intensive, and focus more on insurance industry practices, regulation, and law. While studying for the preliminary exams, I was so overwhelmed with math that I couldn’t focus on learning maths more relevant to my specific job (the math in the exams is related in a background sense, but as far as work goes the actual math I use is much different), along with pure math that I’ve always been wanting to learn. Although the upper examinations require more study time, I think the reduction in math required will let me spend my ‘math energy’ elsewhere.

-I’ve finished up learning the basics of SQL (as in, I’ve finished reading Learning SQL). I’m currently reading Excel & Access Integration, which I believe will give me some very useful skills with respect to data manipulation. Many actuaries know VBA, many actuaries know SQL, but there aren’t a lot of actuaries who can integrate them together effectively, so if I can acquire this ability I’ll be able to fulfill a niche role that’s lacking at many companies. I didn’t find MySQL difficult, and query writing came naturally since I had already been using MSAccess intensively 6 months before picking up the book. The only things I found difficult were correlated subqueries and the chapters on low-level database design and administration. The next thing I have on my reading list is Using R for Introductory Statistics. I actually read through the first 60 pages or so in 2011 before I stopped to study for C/4. I hope to get that finished up before March when things get really busy.

Posted in: Logs / Tagged: Actuarial Exams, exam MFE, exam mfe pass mark, exam MFE score, Learning SQL, predictive modeling, R

Archives

  • September 2023
  • February 2023
  • January 2023
  • October 2022
  • March 2022
  • February 2022
  • December 2021
  • July 2020
  • June 2020
  • May 2020
  • May 2019
  • April 2019
  • November 2018
  • September 2018
  • August 2018
  • December 2017
  • July 2017
  • March 2017
  • November 2016
  • December 2014
  • November 2014
  • October 2014
  • August 2014
  • July 2014
  • June 2014
  • February 2014
  • December 2013
  • October 2013
  • August 2013
  • July 2013
  • June 2013
  • March 2013
  • January 2013
  • November 2012
  • October 2012
  • September 2012
  • August 2012
  • July 2012
  • June 2012
  • May 2012
  • April 2012
  • March 2012
  • February 2012
  • January 2012
  • December 2011
  • September 2011
  • August 2011
  • July 2011
  • June 2011
  • January 2011
  • December 2010
  • October 2010
  • September 2010
  • August 2010
  • June 2010
  • May 2010
  • April 2010
  • March 2010
  • September 2009
  • August 2009
  • May 2009
  • December 2008

Categories

  • Actuarial
  • Cycling
  • Logs
  • Mathematics
  • MIES
  • Music
  • Uncategorized

Links

Cyclingnews
Jason Lee
Knitted Together
Megan Turley
Shama Cycles
Shama Cycles Blog
South Central Collegiate Cycling Conference
Texas Bicycle Racing Association
Texbiker.net
Tiffany Chan
USA Cycling
VeloNews

Texas Cycling

Cameron Lindsay
Jacob Dodson
Ken Day
Texas Cycling
Texas Cycling Blog
Whitney Schultz
© Copyright 2025 - Gene Dan's Blog
Infinity Theme by DesignCoral / WordPress