• Home
  • Readings
  • Github
  • MIES
  • TmVal
  • About
Gene Dan's Blog

Monthly Archives: July 2013

You are browsing the site archives by month.

No. 93: On Ramanujan

29 July, 2013 8:52 PM / Leave a Comment / Gene Dan

I had first learned of Srinivasa Ramanujan during my junior year of college when I was flipping through the pages of my number theory book, reading the various biographies of the text’s featured mathematicians. I stumbled upon Atle Selberg’s profile, which mentioned that he was inspired to study mathematics after reading the work of Ramanujan, an early 20th-century Indian mathematician. From there, I read the remarkable story about Ramanujan’s upbringing, how he was born into poverty and, despite having no formal training in rigorous mathematics, produced some of the most profound results pertaining to number theory. I learned that although he was poor, Ramanujan benefited from his network of friends – a group of Brahmin intellectuals who recognized his mathematical talents and encouraged him to seek help by writing to three of the world’s leading mathematicians of the day – H.F. Baker, E.W. Hobson, and G.H. Hardy. While Baker and Hobson dismissed Ramanujan’s work, Hardy decided to bring Ramanujan to Cambridge and subsequently worked with him over the next six years, until his untimely death at the age of 32.

This wasn’t the first time I encountered Hardy’s work, I believe I first saw mention of his name when I was taking AP Biology in high school via the Hardy-Weinberg principle regarding the inter-generation distribution of genotypes in a population. We weren’t required to know the principle in detail – we just had to memorize some basic facts regarding what subject area it covered and why the principle was important. It wasn’t until I had read Hardy’s A Mathematician’s Apology 7 years later that I connected his name with what I had learned as a junior in biology class (although, I would imagine, based on Hardy’s writings that he would be disappointed to see his name connected to a practical application in biology).

Around the time I had been applying for jobs after college, I came across a book called The Man who Knew Infinity, which is a biography of both Ramanujan and Hardy, their respective upbringings, and their time collaborating with each other at Cambridge. I had placed it on my list of books that I would like to read and finally got around to it earlier this month during the 4th of July weekend and finished it earlier this morning. I’d say it’s my favorite biography – not only did it cover the lives of Ramanujan and Hardy, but it also covered the socioeconomic and political atmosphere during the early 20th century in both the British Raj and the British Isles.

What strikes me the most is that there were so many times in Ramanujan’s life where he was destined for failure – he failed out of college not only once but twice – not because he wasn’t smart enough to pass the examinations, but because he was so focused on mathematics at the time that he neglected his other subjects. There were numerous occasions where he nearly starved to death, and resources were always an issue – he had only a handful of books from which to extrapolate his discoveries, one of which being Loney’s Plane Trigonometry, and another being George Carr’s Synopsis of Pure Mathematics, a study guide for the mathematical Tripos examination at Cambridge. Hardy speculated that if it weren’t for his early death and haphazard upbringing, Ramanujan could have been the greatest mathematician who ever lived. It’s stories like these that are not only inspiring but also make you thankful for your circumstances. It makes you question whether or not you’re doing the best with what you’ve got or if you’re just throwing it all away.
Posted in: Logs, Mathematics / Tagged: gh hardy, hardy, ramanujan, srinivasa ramanujan, the man who knew infinity

No. 92: Vector Addition in SAGE

22 July, 2013 8:03 PM / 1 Comment / Gene Dan

Today I’d like to introduce you to some simple examples of vector addition in SAGE. I have been reading Lang’s introductory text to linear algebra, the first chapter of which covers properties of vectors.

SAGE can be used alongside Lang’s text as a gentle introduction to computer algebra systems. In my experience, I’ve found that bridging the gap between computer and paper mathematics can be intimidating, especially if a mathematics student doesn’t have a background in computer programming.

I’ve previously outlined why I think SAGE is an ideal educational tool, but to rehash it’s mainly because SAGE is open source and it uses Python as the language to execute commands. The open source nature of the software allows the student to examine what exactly is going on behind the user interface, and Python is a high-level programming language that lets the student execute commands right away without getting bogged down with low-level details like computer memory management.

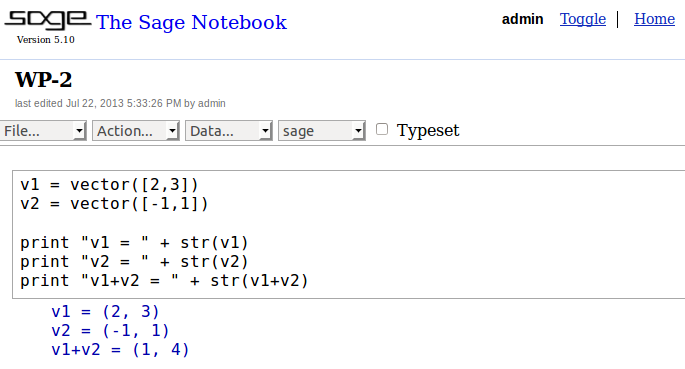
To get started, I’ll declare and print two vectors in SAGE, v1 and v2:

wp_92-1

The first two lines in the above example declare the two vectors as variables, and the last three lines print v1, v2, and their sum in the output. Declaration of variables and the print function should be familiar to Python users.

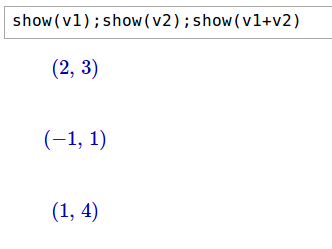
We can also use SAGE to display the vectors in prettyprint, which means to display the vectors in a manner similar to what you’d see in a publication:

wp_92-2

Furthermore the latex() function outputs the LaTeX code – which is what you’d use to typeset such a publication:

wp_92-3In this case you would type \left(2,\,3\right) in your LaTeX editor.

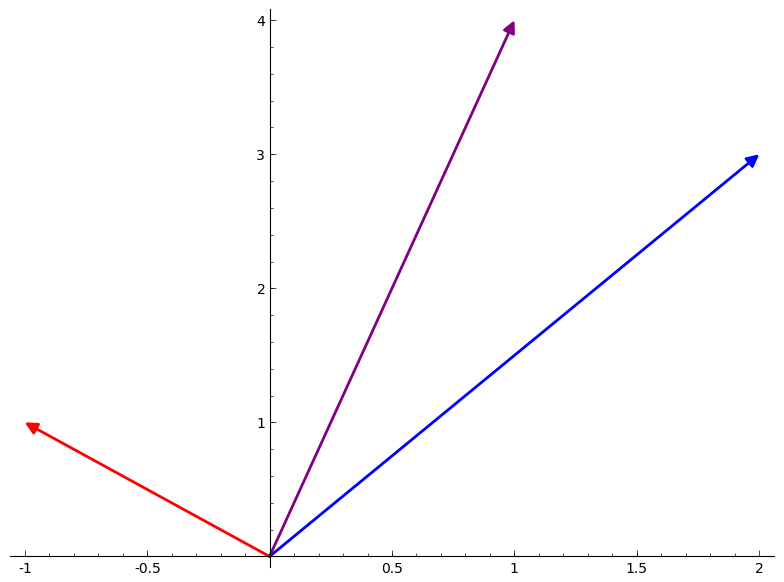
In the following diagram, you can see that each vector can be represented as a point on a two-dimensional plane. v1 and v2 are represented in blue and red, respectively, and their sum, v1+v2, in purple:

[code language=”python”]
show(plot(v1,color=”blue”)+plot(v2,color=”red”)+plot(v1+v2,color=”purple”))
[/code]

wp_92-4

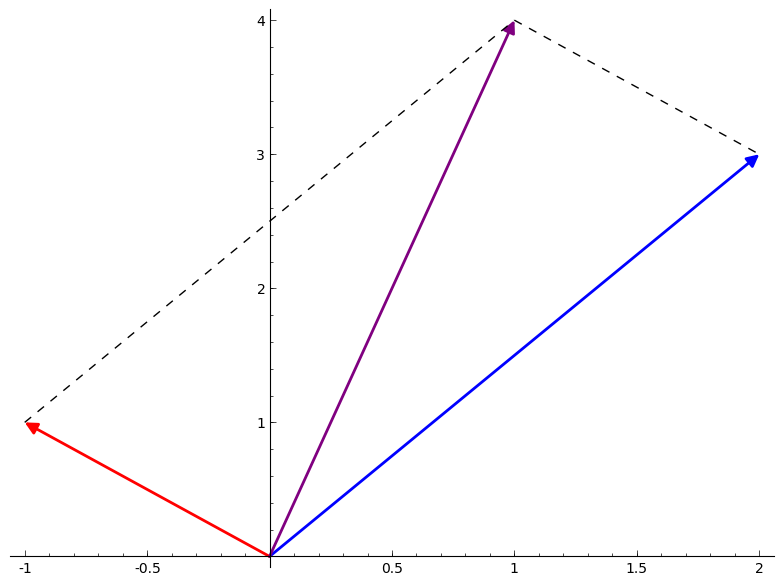
We can now use SAGE’s plotting capabilities to depict the Parallelogram Rule for vector addition, which states that the sum of two vectors can be represented as the fourth vertex of the parallelogram whose other three vertices are the two component vectors and the origin:

[code language=”python”]
l1=line([[1,4],[2,3]],linestyle=”–“,color=”black”)
l2=line([[-1,1],[1,4]],linestyle=”–“,color=”black”)
show(plot(v1,color=”blue”)+plot(v2,color=”red”)+plot(v1+v2,color=”purple”)+plot(l1)+plot(l2))
[/code]

wp_92-5Here, I have declared two additional variables as dashed line segments, and added them to the plot to complete the parallelogram.

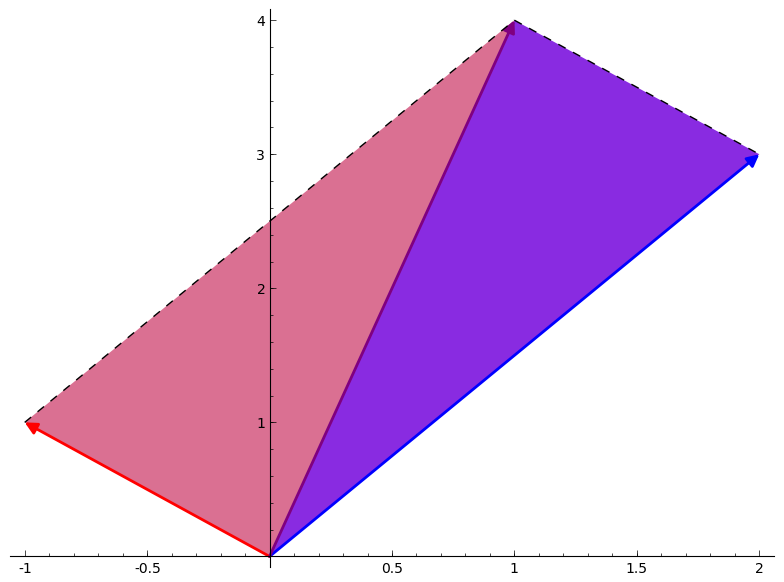
SAGE also lets you declare and plot polygons. In the example below I have declared two polygons, p1 and p2, and shaded them in violet blue and violet red, respectively:

[code language=”python”]
p1 = polygon([(0,0),(1,4),(2,3)],rgbcolor=(138/256,43/256,226/256))
p2 = polygon([(-1,1),(0,0),(1,4)],rgbcolor=(219/256,112/256,147/256))
show(plot(v1,color=”blue”)+plot(v2,color=”red”)+plot(v1+v2,color=”purple”)+plot(l1)+plot(l2)+plot(p1)+plot(p2))
[/code]

wp_92-6As you can see, the parallelogram can be depicted as two triangles of equal size.

That’s it for today. I’ll soon follow up with another post on vector multiplication, and maybe some more properties such as equivalence and parallelism.

Posted in: Logs, Mathematics / Tagged: python, SAGE, sage LaTeX, SAGE linear algebra, sagemath, vector addition sage, vector plot sage

No. 91: Learning Linear Algebra

15 July, 2013 8:44 PM / 1 Comment / Gene Dan

I started learning linear algebra a couple weeks ago. I’m taking a three-pronged approach to study:

Linear Algebra – David Lay

Lay’s book isn’t very heavy on theory and mostly covers matrix computations. I took an introductory course in Linear Algebra over a five-week period back in 2007, so I’ve already done most of the problems in this book. However, since the course was so short, naturally cramming was involved as I scrambled to cover the entire textbook in a little more than a month – so with respect to this I didn’t benefit from the spacing effect to commit the things I learned into long-term memory. I think a review would be helpful since my current job duties demand that I understand matrices well.

Introduction to Linear Algebra – Serge Lang

Serge Lang wrote an introductory text that is a little bit more theoretically rigorous than Lay’s book. This reading is pretty short at 280 pages, and contains a modest number of problems (328). I’m reading this mostly at a pretty slow pace (4 pages a day), so I should be done in about 2 months. This mainly serves as a supplementary text to Lay.

Sage

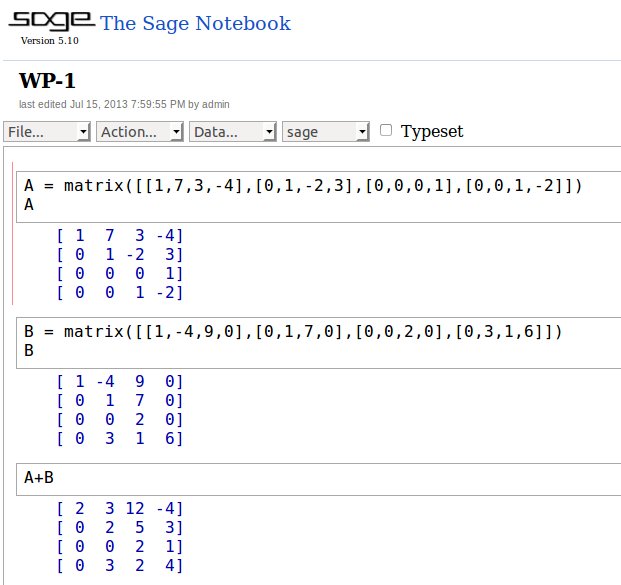
I wrote about Sage a couple years ago, and I’m finally putting it to use to help myself learn linear algebra. Sage is an open-source project aimed at creating a free, viable alternative to proprietary computer algebra systems such as Mathematica, Matlab, and Maple. I’m starting out by reading the Sage Tutorial and applying the built-in commands to the problems from Lay’s book. For example, here is a screenshot of the Sage Notebook:

SageNb

Here, you can see three cells of code along with output for each one. The first cell contains two commands, one to declare a matrix A, and another to show it:

\[A=\left[ \begin{array}{rrrr} 1 & 7 & 3 & -4\\0 & 1 & -2 & 3 \\0 & 0 & 0 & 1 \\ 0 & 0 & 1 & -2 \end{array} \right] \]

The second cell declares and prints matrix B:

\[B=\left[ \begin{array}{rrrr} 1 & -4 & 9 & 0\\0 & 1 & 7 & 0\\0 & 0 & 2 & 0\\0 & 3 & 1 & 6 \end{array} \right] \]

The third cell adds the two matrices together:

\[A+B=\left[ \begin{array}{rrrr} 1 & 7 & 3 & -4\\0 & 1 & -2 & 3 \\0 & 0 & 0 & 1 \\ 0 & 0 & 1 & -2 \end{array} \right]+\left[ \begin{array}{rrrr} 1 & -4 & 9 & 0\\0 & 1 & 7 & 0\\0 & 0 & 2 & 0\\0 & 3 & 1 & 6 \end{array} \right]=\left[ \begin{array}{rrrr} 2 & 3 & 12 & -4\\0 & 2 & 5 & 3\\0 & 0 & 2 & 1\\0 & 3 & 2 & 4 \end{array} \right]\]

Vector Addition

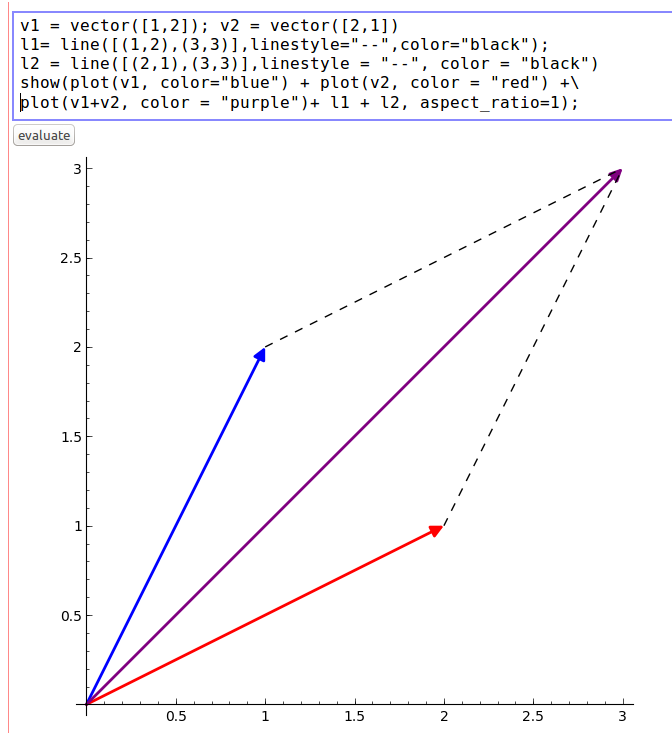
I really like Sage’s plotting capabilities. The following example declares two vectors, v1 and v2, and plots their sum, which is also a vector. v1 is blue, v2 is red, and the vector sum is purple:

SageNb4


I added some dashed lines (which are declared as l1 and l2 in the cell) to complete the parallelogram in the plot. This shows that the sum of two vectors can be represented as the fourth vertex of the parallelogram where the other three vertices are its component vectors and the origin.

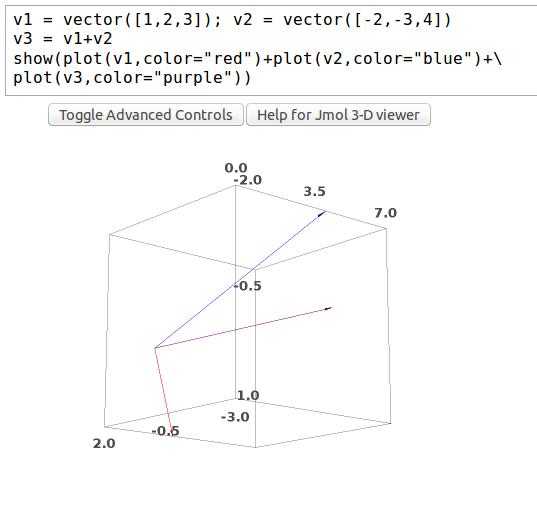
Sage also has 3D plotting capabilities. The following example shows the sum of two vectors in three-space along with its components:

SageNb5

Posted in: Logs, Mathematics / Tagged: david lay linear algebra, introduction to linear algebra, linear algebra, sagemath, serge lang, vector plot sage

No. 90: The Houston Machine Learning Group

1 July, 2013 8:02 PM / Leave a Comment / Gene Dan

Last month I received a message from Pankaj Maheshwari to join a new meetup group called The Houston Machine Learning Group. I’d been interested in machine learning for quite some time, so I decided to sign up out of curiosity. Within a couple of days, Pankaj was able to gather about 20 of us together, and we all decided to meet up last week at Platform Houston, which is a development space at Rice Village where startups work.

As usual, the Rice Village area was packed full of cars and people, and parking was difficult. After I managed to find a spot, I walked over to Platform Houston and introduced myself to the other members, who represented a wide range of industries like oil & gas, biotech, finance, academia, and software engineering. I found the other members to be very friendly and highly intelligent – after we introduced ourselves, Pankaj told us that he started the group because he noticed that Houston was home to many industries that could benefit from machine learning, but did not have a machine learning community from which to draw talent and share ideas.

The meeting got off to a slow start, but after we got acquainted with each other, we came up with several ideas of projects we could work on, many of which I thought were interesting:

Biotech – Hospitals routinely collect biometric data on their patients, but it wasn’t until recently that they were able to store large quantities of real-time data (one member mentioned that a hospital could store up to a terabyte a day worth of data). The amount of data has gotten so large that it has become difficult to analyze by human means – and machine learning could help discover patterns that we would otherwise miss. For example, imagine a world where each of the nation’s hospitals were linked together via a communications network, and machine learning was able to detect emerging pandemics based on patient data. This would allow governmental organizations such as the CDC to react quickly to such events – which would potentially save millions of lives.

Oil & Gas – Machine learning could optimize the supply chains of oil & gas companies.

Finance & Energy Trading – Machine learning can accurately interpret and place trade orders by analyzing text via natural language processing.

Voting – Machine learning can discover patterns amongst voting populations – this would have a direct impact on political campaigns, and may also keep politicians better informed of their constituents’ interests once they arrive in office.

Traffic – Machine learning could analyze traffic patterns in metropolitan areas to help traffic engineers optimize flow.

Pankaj himself is the founder of two startups, one of which is very close to my workplace called Net Matrix Solutions, which is an IT staffing firm. He expressed an interest in Kurweil, technological singularity, and had the ambitious goal of enabling computers to not only learn from large datasets, but to also be curious about the patterns discovered via learning. He told us that he currently spends 2-3 hours a day looking into machine learning.

Overall, I thought the meetup was very fun, and I really enjoyed meeting people with similar interests. I’m pretty excited to be involved in the group and its projects over the near future.
2262bd2783b604ef158106c28159d5c5

Posted in: Logs / Tagged: data science, houston, machine learning, the houston machine learning group

Archives

  • September 2023
  • February 2023
  • January 2023
  • October 2022
  • March 2022
  • February 2022
  • December 2021
  • July 2020
  • June 2020
  • May 2020
  • May 2019
  • April 2019
  • November 2018
  • September 2018
  • August 2018
  • December 2017
  • July 2017
  • March 2017
  • November 2016
  • December 2014
  • November 2014
  • October 2014
  • August 2014
  • July 2014
  • June 2014
  • February 2014
  • December 2013
  • October 2013
  • August 2013
  • July 2013
  • June 2013
  • March 2013
  • January 2013
  • November 2012
  • October 2012
  • September 2012
  • August 2012
  • July 2012
  • June 2012
  • May 2012
  • April 2012
  • March 2012
  • February 2012
  • January 2012
  • December 2011
  • September 2011
  • August 2011
  • July 2011
  • June 2011
  • January 2011
  • December 2010
  • October 2010
  • September 2010
  • August 2010
  • June 2010
  • May 2010
  • April 2010
  • March 2010
  • September 2009
  • August 2009
  • May 2009
  • December 2008

Categories

  • Actuarial
  • Cycling
  • Logs
  • Mathematics
  • MIES
  • Music
  • Uncategorized

Links

Cyclingnews
Jason Lee
Knitted Together
Megan Turley
Shama Cycles
Shama Cycles Blog
South Central Collegiate Cycling Conference
Texas Bicycle Racing Association
Texbiker.net
Tiffany Chan
USA Cycling
VeloNews

Texas Cycling

Cameron Lindsay
Jacob Dodson
Ken Day
Texas Cycling
Texas Cycling Blog
Whitney Schultz
© Copyright 2025 - Gene Dan's Blog
Infinity Theme by DesignCoral / WordPress