Actuarial exams can be a grueling process – they can take anywhere between 4 and 10 years to complete, maybe even longer. Competition can be intense, and in recent years the pass rates have ranged from 14% to a little over 50%. In response to these pressures, students have adopted increasingly elaborate strategies to prepare for the exams – one of which is spaced repetition – a learning technique that maximizes retention while minimizing the amount of time spent studying.
Spaced repetition works by having students revisit material shortly before they are about to forget it again, and then gradually increasing the time interval between repetitions. For example, if you were to solve a math problem, say, 1 + 1 = 2, you might tell yourself that you’ll solve it again in three days, or else you’ll forget. If you solve it correctly again three days later, you’ll then tell yourself that you’ll do it again in a week, then a month, then a year, and so on…
As you gradually increase the intervals between repetitions, that problem transitions from being stored in short-term memory to being stored in long-term memory. Eventually, you’ll be able to retain a fact for years, or possibly even your entire life. For more information on the technique, read this excellent article by Gwern.
Nowadays such a strategy is assisted with software, since as the number of problems increases, it becomes increasingly difficult to keep track of what you need to review and when. The software I like to use is called Anki, which is one of the most popular SRS out there. In order to use Anki, you have to translate what you study into a Q/A flashcard format, or download a pre-made deck from elsewhere and load it into the software. Then, you study the cards much like you would a physical deck of cards.
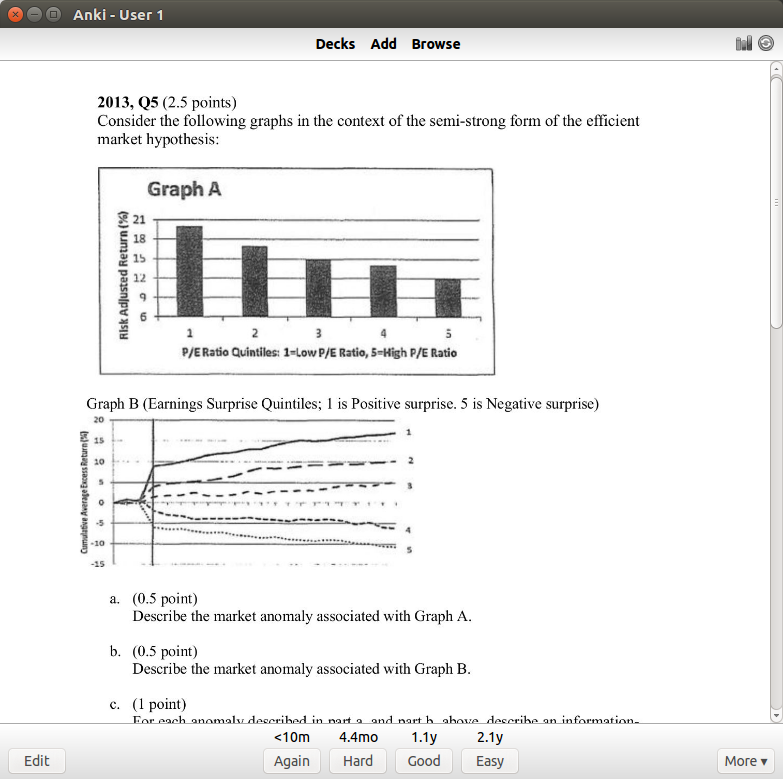
Here’s a typical practice problem from my deck:
This is a problem on the efficient market hypothesis. If I get it right, I can select one of three options for when I want to revisit it again. If I had an easy time, I’ll select 2.1 years (which means I won’t see it again until 2020). If I got it right but had a hard time with it, I’ll choose 4.4 months, which means I’ll see it again next May. These intervals might seem large, but that’s because I’ve done this particular problem several times. Starting out, intervals will just be a few days apart.
Now, my original motivations didn’t actually stem from the desire to pass actuarial exams, but rather my frustration at forgetting material shortly after I’ve studied a subject. If you’re like me, maybe you’ll forget half the material a month after you’ve taken a test, and then maybe you’ll have forgotten most of it a year later. That doesn’t sit well with me, so four years ago, I made it a point to use spaced repetition on everything I’ve studied.
Despite spaced repetition sounding promising at the time, I was extremely skeptical that it would work, so I started with some basic math and computer science – it wasn’t until about a year after I started using the software that I trusted it enough to apply it to high-stakes testing – that is, actuarial exams – and having used the software for four years, I’ve concluded that, for the most part, it works.
Exploring Anki
Anki keeps its data in a SQLite database, which makes it suitable for ad hoc queries and quantitative analysis on your learning – that is, studies on your studies. The SQLite file is called collection.anki2, which I will be querying for the following examples. Anki provides some built-in graphs that allow you to track your progress, but querying the SQLite file itself will open up more options for self-assessment. Some minutiae on the DB schema and data fields are in the Appendix at the end of this post.
Deck Composition
Actuarial science is just one of the many subjects that I study. In fact, in terms of deck size, it only makes up a small portion of the total cards I have in my deck, as seen in the treemap below:
You can see here that actuarial (top right corner) makes up less than an eighth of my deck. I try to be a well-rounded individual, so the other subjects involve accounting, computer science, biology, chemistry, physics, and mathematics. The large category called “Misc” is mostly history and philosophy.
I separate my deck into two main categories – problems, and everything else. Problems are usually math and actuarial problems, and these take significantly more time than the other flashcards. I can’t study problems while I’m on the go or commuting since they typically involve pencil/paper or the use of a computer.
Here’s the code used to generate the treemap (setup included):
|
1 2 3 4 5 6 7 8 9 10 11 12 13 14 15 16 17 18 19 20 21 22 23 24 25 26 27 28 29 30 31 32 33 34 35 36 37 38 39 40 41 42 43 44 45 46 47 48 49 |
library(RSQLite) library(DBI) library(rjson) library(anytime) library(sqldf) library(ggplot2) library(zoo) library(reshape2) library(treemap) options(scipen=99999) con = dbConnect(RSQLite::SQLite(),dbname="collection.anki2") #get reviews rev <- dbGetQuery(con,'select CAST(id as TEXT) as id , CAST(cid as TEXT) as cid , time from revlog') cards <- dbGetQuery(con,'select CAST(id as TEXT) as cid, CAST(did as TEXT) as did from cards') #Get deck info - from the decks field in the col table deckinfo <- as.character(dbGetQuery(con,'select decks from col')) decks <- fromJSON(deckinfo) names <- c() did <- names(decks) for(i in 1:length(did)) { names[i] <- decks[[did[i]]]$name } decks <- data.frame(cbind(did,names)) decks$names <- as.character(decks$names) decks$actuarial <- ifelse(regexpr('[Aa]ctuar',decks$names) > 0,1,0) decks$category <- gsub(":.*$","",decks$names) decks$subcategory <- sub("::","/",decks$names) decks$subcategory <- sub(".*/","",decks$subcategory) decks$subcategory <- gsub(":.*$","",decks$subcategory) cards_w_decks <- merge(cards,decks,by="did") deck_summary <- sqldf("SELECT category, subcategory, count(*) as n_cards from cards_w_decks group by category, subcategory") treemap(deck_summary, index=c("category","subcategory"), vSize="n_cards", type="index", palette = "Set2", title="Card Distribution by Category") |
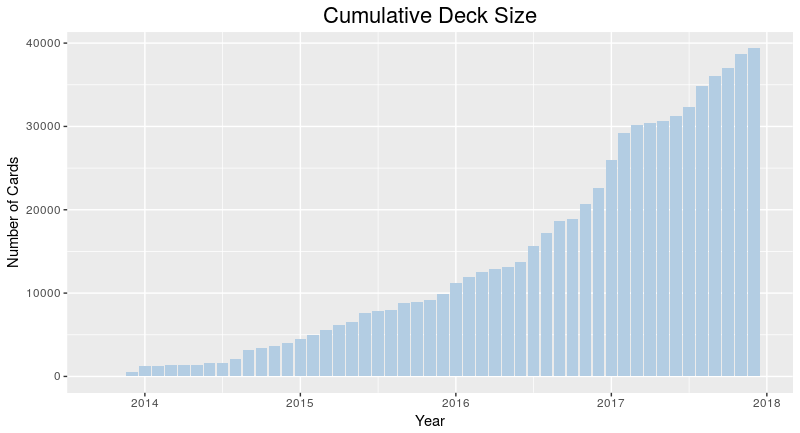
The figure above indicates that I have about 40,000 cards in my collection. That sounds like a lot – and one thing I worried about during this experiment was whether I’d ever get to the point where I would have too many cards, and would have to delete some to manage the workload. I can safely say that’s not the case, and four years since the start, I’ve been continually adding cards, almost daily. The oldest cards are still in there, so I’ve used Anki as a permanent memory bank of sorts.
|
1 2 3 4 5 6 7 8 9 10 11 |
cards$created_date <- as.yearmon(anydate(as.numeric(cards$cid)/1000)) cards_summary <- sqldf("select created_date, count(*) as n_cards from cards group by created_date order by created_date") cards_summary$deck_size <- cumsum(cards_summary$n_cards) ggplot(cards_summary,aes(x=created_date,y=deck_size))+geom_bar(stat="identity",fill="#B3CDE3")+ ggtitle("Cumulative Deck Size") + xlab("Year") + ylab("Number of Cards") + theme(axis.text.x=element_text(hjust=2,size=rel(1))) + theme(plot.title=element_text(size=rel(1.5),vjust=.9,hjust=.5)) + guides(fill = guide_legend(reverse = TRUE)) |
Time Spent
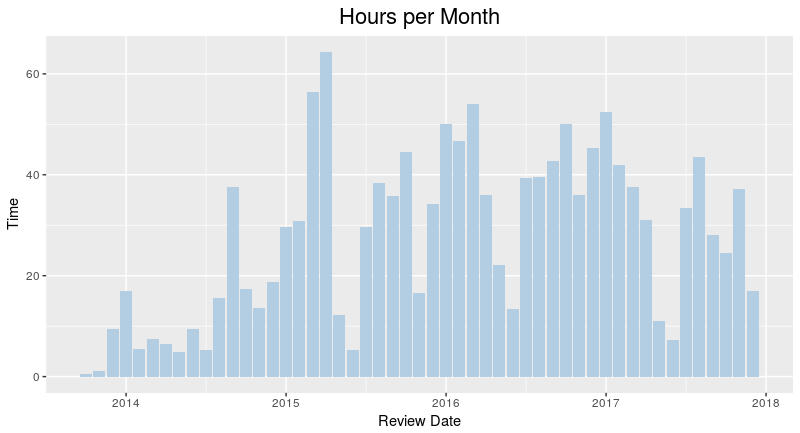
From the image above, you can see that while my deck gets larger and larger, the amount of time I’ve spent studying per month has remained relatively stable. This is because older material is spaced out while newer material is reviewed more frequently.
|
1 2 3 4 5 6 7 8 9 |
time_summary <- sqldf("select revdate, sum(time) as Time from rev_w_decks group by revdate") time_summary$Time <- time_summary$Time/3.6e+6 ggplot(time_summary,aes(x=revdate,y=Time))+geom_bar(stat="identity",fill="#B3CDE3")+ ggtitle("Hours per Month") + xlab("Review Date") + theme(axis.text.x=element_text(hjust=2,size=rel(1))) + theme(plot.title=element_text(size=rel(1.5),vjust=.9,hjust=.5)) + guides(fill = guide_legend(reverse = TRUE)) |
Actuarial Studies
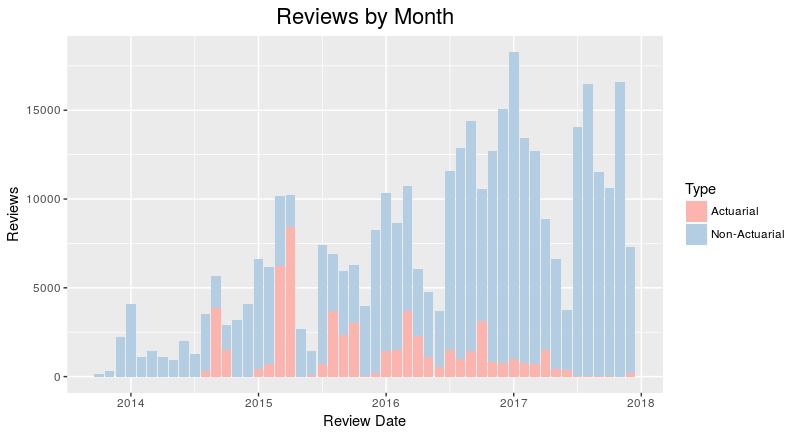
Where does actuarial fit into all of this? The image above divides my reviews into actuarial and non-actuarial. From the image, you can tell that there’s some seasonality component as the number of reviews tends to ramp up during the spring and fall – when the exams occur. I didn’t have a fall exam in 2017, so you can see that I didn’t spend much time on actuarial material then.
The graph is, however, incredibly deceiving. While it looks like I’ve spent most of my time studying things other than actuarial science, that’s not the case during crunch time. Actuarial problems tend to take much longer than a normal problem, about 6 – 10 minutes versus 2 – 10 seconds for a normal card. I would have liked to make a time comparison, but the Anki default settings cap review time at 1 minute, something I realized too late to change the settings for the data to be meaningful, so there is a bit of GIGO going on here.
|
1 2 3 4 5 6 7 8 9 10 11 12 13 14 15 16 17 18 19 20 21 |
#Date is UNIX timestamp in milliseconds, divide by 1000 to get seconds rev$revdate <- as.yearmon(anydate(as.numeric(rev$id)/1000)) #Assign deck info to reviews rev_w_decks <- merge(rev,cards_w_decks,by="cid") rev_summary <- sqldf("select revdate,sum(case when actuarial = 0 then 1 else 0 end) as non_actuarial,sum(actuarial) as actuarial from rev_w_decks group by revdate") rev_counts <- melt(rev_summary, id.vars="revdate") names(rev_counts) <- c("revdate","Type","Reviews") rev_counts$Type <- ifelse(rev_counts$Type=="non_actuarial","Non-Actuarial","Actuarial") rev_counts <- rev_counts[order(rev(rev_counts$Type)),] rev_counts$Type <- as.factor(rev_counts$Type) rev_counts$Type <- relevel(rev_counts$Type, 'Non-Actuarial') ggplot(rev_counts,aes(x=revdate,y=Reviews,fill=Type))+geom_bar(stat="identity")+ scale_fill_brewer(palette="Pastel1",direction=-1)+ ggtitle("Reviews by Month") + xlab("Review Date") + theme(axis.text.x=element_text(hjust=2,size=rel(1))) + theme(plot.title=element_text(size=rel(1.5),vjust=.9,hjust=.5)) + guides(fill = guide_legend(reverse = TRUE)) |
Appendix: Raw Data and Unix Timestamps
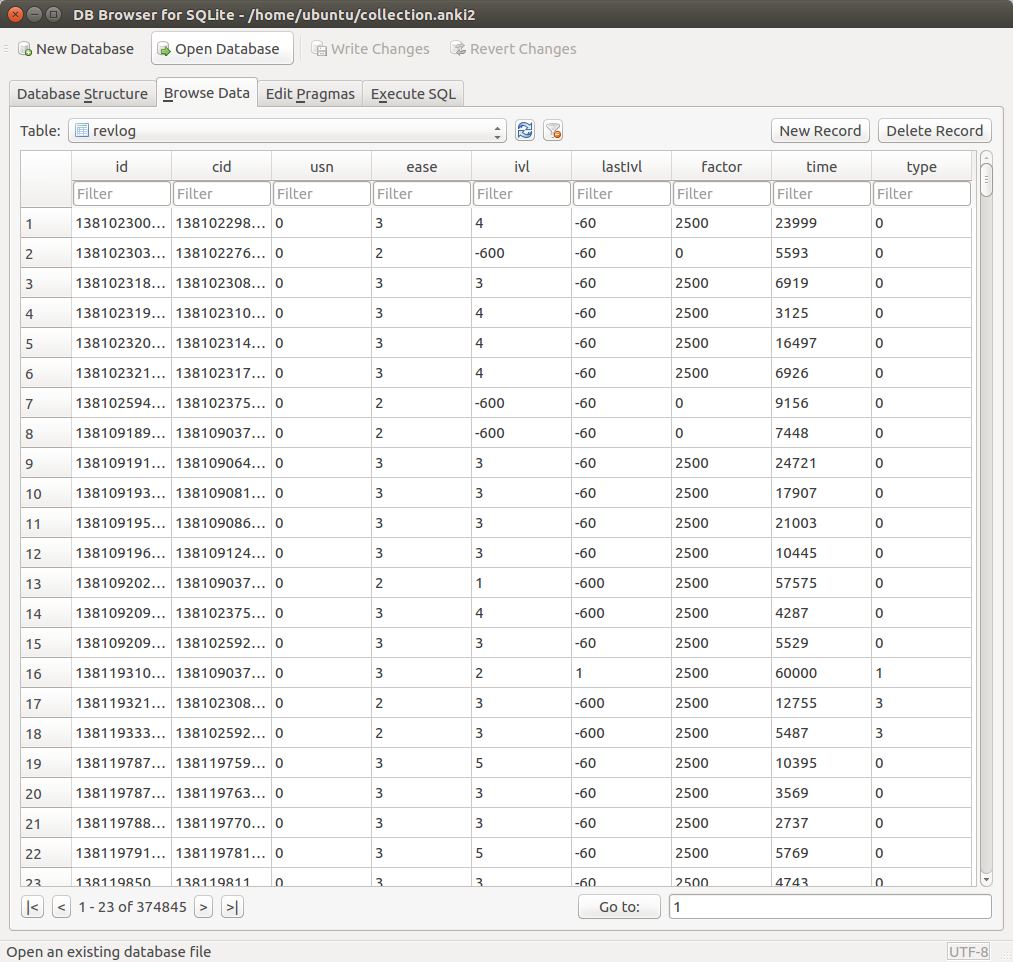
The raw data stored in Anki are actually not so easy to work with. Due to the small size of the database, I thought working with it would be easy, but it actually took several hours. The SQLite database contains six tables, one of which contains the reviews. That is, every time you review a card, Anki creates a new record in the database for that review:
These data are difficult to understand until you spend some time trying to figure out what it all means. I found a schema on github, which helped greatly in deciphering the data. This data contains information such as when you studied a card, how long you spent on it, how hard it was, and when you’ll be seeing it again.
What was interesting to note is that the time values are stored as Unix timestamps – that is, the long integers in the id column at first don’t seem like they’d mean anything, but they actually do. For example, the value 1381023008835 actually means the number of milliseconds that have passed since 1 January 1970, which translates to October 6, 2013, the date when the card was reviewed. These values were used to calculate the time-related values in the examples.
