• Home
  • Readings
  • Github
  • MIES
  • TmVal
  • About
Gene Dan's Blog

Monthly Archives: April 2019

You are browsing the site archives by month.

No. 133: Interfacing with MYLIN using psycopg2

28 April, 2019 8:46 PM / Leave a Comment / Gene Dan

Introducing MYLIN

MYLIN is the storage system for MIES, an insurance simulation engine I introduced back in November. It is envisioned to consist of a collection of Postgresql databases representing the various firms as well as the attributes of the environment in which they coexist. Although AWS seems to be promoting the use of NoSQL services such as DynamoDB, I have opted not to use them yet as most insurance companies I’ve encountered heavily rely on relational databases, or even IBM mainframes for storing data. Furthermore, SQL ought to be a core skill for actuaries and other analytical professionals for the foreseeable future, so Postgres should be a suitable choice given its rich features, ANSI compliance, and open source development.

MYLIN is named after Maya Lin, the architect. Alternatively, it also refers to myelin, the biological substance that insulates neurons. I suppose it could also be short for My Linh, a common Vietnamese name for females, but I’m not going to promote that interpretation heavily. Otherwise, it doesn’t stand for anything as an acronym.

psycopg2

MIES, as currently envisioned, is primarily written in Python. Since the routines for simulating losses and other events are written in Python, a library is required to access Postgres in order to populate the database tables with the output from these routines. The most popular library is psycopg2, which lets you easily establish a connection to Postgres, create tables, and execute queries against the database.

There are plenty of tutorials out there on how to install and configure Postgres, so I won’t go there. Today I’ll go over the structure of what I’ve got in place for MIES/MYLIN so far, and where I’ll need to go from there. Right now, I have four modules pushed to the GitHub repository:

  1. connect.py – a script used to establish a connection to Postgres
  2. config.py – a script that reads in parameters pertaining to my instance of Postgres
  3. create_tables.py – a script used to create tables for MYLIN
  4. populate_claims.py – a simple script that generates 10 random claims and writes them to the database

Connecting to Postgres

For now I’ve created a database on my local machine called claimsystem. This all subject to change, especially once I move things onto AWS. But for now, my first goal is to figure out how to establish a connection to Postgres and execute queries via Python. I’ve adapted some code from a tutorial I read. For the most part, it’s not much different, except I’ve imported the os module to refer to my configuration file via a relative path which points outside the repository, since I don’t want to upload it to GitHub (alternatively, I could put the file in .gitignore). I feel uncomfortable leaving a password in a plain text file, so I’m actively looking for a more secure way to handle the connection (suggestions welcome):

Python
1
2
3
4
5
6
7
8
9
10
11
12
13
14
15
16
17
18
19
20
21
22
23
24
25
26
27
28
29
30
31
32
33
34
35
36
37
38
39
#!/usr/bin/python
import psycopg2
import os
from config import config
 
#keep the config file out of the repository until I figure out a more secure way to handle this
ini_path = os.path.abspath(os.path.join(__file__,"../../..","database.ini"))
 
 
def connect():
    """ Connect to the PostgreSQL database server """
    conn = None
    try:
        # read connection parameters
        params = config(ini_path)
 
        # connect to the PostgreSQL server
        print('Connecting to the PostgreSQL database...')
        conn = psycopg2.connect(**params)
 
        # create a cursor
        cur = conn.cursor()
 
# execute a statement
        print('PostgreSQL database version:')
        cur.execute('SELECT version()')
 
        # display the PostgreSQL database server version
        db_version = cur.fetchone()
        print(db_version)
 
     # close the communication with the PostgreSQL
        cur.close()
    except (Exception, psycopg2.DatabaseError) as error:
        print(error)
    finally:
        if conn is not None:
            conn.close()
            print('Database connection closed.')

Referencing the code above, I’ve also imported a module called config, which is the script that reads in the database connection parameters:

Python
1
2
3
4
5
6
7
8
9
10
11
12
13
14
15
16
17
18
19
#!/usr/bin/python
from configparser import ConfigParser
 
def config(filename, section='postgresql'):
    # create a parser
    parser = ConfigParser()
    # read config file
    parser.read(filename)
 
    # get section, default to postgresql
    db = {}
    if parser.has_section(section):
        params = parser.items(section)
        for param in params:
            db[param[0]] = param[1]
    else:
        raise Exception('Section {0} not found in the {1} file'.format(section, filename))
 
    return db

Creating Tables

The next step is to create some tables in the database. Since I’d like to just test out psycopg2’s ability to connect and execute queries, it’s best to keep things simple for now, test the connection, and then increase the complexity from there. For now, I’ve created one table called Claim with two fields, claim_id – to identify each claim, and loss_amount – the corresponding loss amount. This table will hold 10 randomly generated claims along with their corresponding identifiers and loss amounts.

To create the table, I’ll need to send the following query to Postgres:

PgSQL
1
2
3
4
CREATE TABLE Claim (
            claim_id SERIAL PRIMARY KEY,
            loss_amount NUMERIC NOT NULL
        )

Since claim_id is of type SERIAL, it’s automatically generated each time a new record is created. This means I only have to worry about the loss amount (for now). The next step is to embed this query into a Python script, using psycopg2 to connect and send the query to the database:

Python
1
2
3
4
5
6
7
8
9
10
11
12
13
14
15
16
17
18
19
20
21
22
23
24
25
26
27
28
29
30
31
32
33
34
35
36
37
38
39
import psycopg2
import os
from config import config
 
#keep the config file out of the repository until I figure out a more secure way to handle this
ini_path = os.path.abspath(os.path.join(__file__,"../../..","database.ini"))
 
def create_tables():
    """ create tables in the PostgreSQL database"""
    commands = (
        """
        CREATE TABLE Claim (
            claim_id SERIAL PRIMARY KEY,
            loss_amount NUMERIC NOT NULL
        )
        """,
        )
    conn = None
    try:
        # read the connection parameters
        params = config(ini_path)
        # connect to the PostgreSQL server
        conn = psycopg2.connect(**params)
        cur = conn.cursor()
        # create table one by one
        for command in commands:
            cur.execute(command)
        # close communication with the PostgreSQL database server
        cur.close()
        # commit the changes
        conn.commit()
    except (Exception, psycopg2.DatabaseError) as error:
        print(error)
    finally:
        if conn is not None:
            conn.close()
 
if __name__ == '__main__':
    create_tables()

Generating Claims

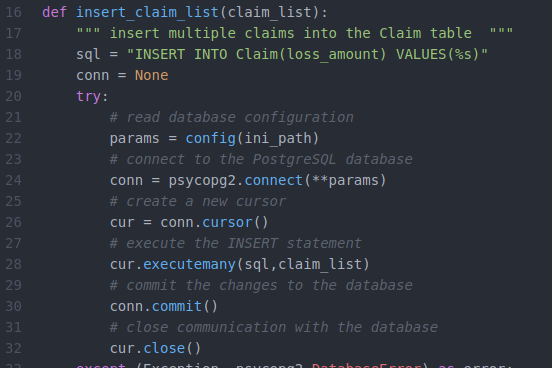
Now, I’d like to see whether I can insert some records to the table I just created. In this example, I’ll generate 10 random claims to be inserted. To do so, I’ve imported the random library from Python to assign a random number to each claim as a loss amount. I’ll worry about making things more mathy and realistic later on, but for now I just need to get the basics right:

Python
1
2
3
4
5
6
7
8
9
10
11
12
13
14
15
16
17
18
19
20
21
22
23
24
25
26
27
28
29
30
31
32
33
34
35
36
37
38
39
40
41
42
#!/usr/bin/python
 
import psycopg2
import random
import os
from config import config
 
#keep the config file out of the repository until I figure out a more secure way to handle this
ini_path = os.path.abspath(os.path.join(__file__,"../../..","database.ini"))
 
#Generate random claims to  be inserted into the Claim table
simple_claims = random.sample(range(1000,10000), 10)
simple_claims = [(x,) for x in simple_claims]
print(simple_claims)
 
def insert_claim_list(claim_list):
    """ insert multiple claims into the Claim table  """
    sql = "INSERT INTO Claim(loss_amount) VALUES(%s)"
    conn = None
    try:
        # read database configuration
        params = config(ini_path)
        # connect to the PostgreSQL database
        conn = psycopg2.connect(**params)
        # create a new cursor
        cur = conn.cursor()
        # execute the INSERT statement
        cur.executemany(sql,claim_list)
        # commit the changes to the database
        conn.commit()
        # close communication with the database
        cur.close()
    except (Exception, psycopg2.DatabaseError) as error:
        print(error)
    finally:
        if conn is not None:
            conn.close()
 
 
if __name__ == '__main__':
    # insert multiple claims
    insert_claim_list(simple_claims)

This seems to have been successful, since if I query the table directly using psql, I can see the results:

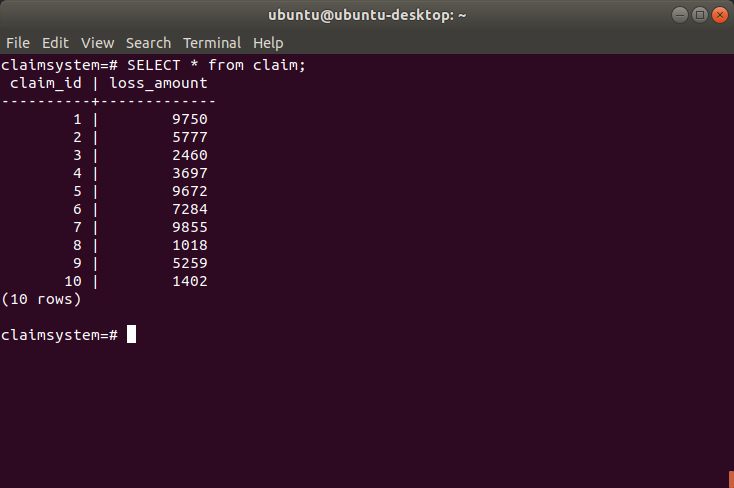
We’ve just got one table with 10 claims and not much else, so one of the next things I want to cover is building a more complete database to represent a data warehouse of an insurance company. I’ll cover this using a pretty neat tool called pgmodeler next week.

Posted in: MIES

No. 132: Exploring Serverless Architectures for MIES

21 April, 2019 9:44 PM / Leave a Comment / Gene Dan

A few months ago, I introduced MIES, an insurance simulation engine. Although I wanted to work on this for the last few years, I had been sidetracked with exams, and more recently, a research project for the Society of Actuaries (SOA) that involved co-authoring a predictive modeling paper with other actuaries and data scientists at Milliman. That effort took an entire year from the initial proposal to its final publication, of which the copy-edit stage is still ongoing. Once it has been published, I’ll provide another update on my thoughts over the whole process.

Meanwhile, I’ve had some time to get back to MIES. As far as technology goes, a lot has changed over the years, including the introduction of serverless computing – implemented in AWS Lambda in 2014. In short, serverless computing is a cloud service that allows you to execute code without having to provision or configure servers or virtual machines. Furthermore, you only need to pay for what you execute, and there is no need to terminate clusters or machines in order to save on costs. Ideally, this should be more cost (and time) effective than other development options that involve allocating hardware.

Since MIES is cloud-based, I thought going serverless would be worth a try, and was further motivated to do so upon the recommendation of a friend. The following image comes from one of the AWS tutorials on serverless web apps. What I have envisioned is similar, with the exception of using Postgres instead of DynamoDB.

Following the tutorial was easy enough, and took about two hours to complete. My overall assessment is that although I was able to get the web app up and running quickly, many of the pieces of the tutorial, such as the files used to construct the web page, and the configuration options for the various AWS services involved (S3, Cognito, DynamoDB, Lambda, API Gateway) were preset without explanation, which made it hard to really understand how the architecture worked, or what all the configuration options did, or why they were necessary. Furthermore, I think a developer would need to have more experience in the component AWS services to be able to build their own application from scratch. Nevertheless, I was impressed enough to want to continue experimenting with serverless architectures for MIES, so I purchased two books to get better at both AWS itself and AWS Lambda:

  1. Amazon Web Services in Action
  2. AWS Lambda in Action

One downside to this approach is that while informative, these types of books tend to go out of date quickly – especially in the case of cloud technologies. For example, I have read some books on Spark that became obsolete less than a year after publication. On the other hand, books offer a structured approach to learning that can be more organized and approachable than reading the online documentation or going to Stack Overflow for every problem that I encounter. This is however, cutting edge technology, and no one approach will cover everything I’ll need to learn. I’ll have to take information wherever I can get it, and active involvement in the community is a must when trying to learn these things.

Going back to the original MIES diagram, we can see that serverless computing is ideal:

I ought to be able to program the modules in AWS Lambda and store the data in Postgres instances. Having multiple firms will complicate things, as will focusing on the final display of information, along with the user interface. For now, I’ll focus on generating losses for one firm, and then reaching an equilibrium with 2 firms. I already have a schema mocked up in Postgres, and will work on connecting to it with Python over the course of the week.

Posted in: MIES / Tagged: MIES

No. 131: Clearing a 12,000 Card Backlog

14 April, 2019 11:33 PM / 5 Comments / Gene Dan

Around this time last year, I was frantically studying for my last actuarial exam. With the future of my career on the line, I decided that in the three to four months leading up to my exam, I would drop everything – that is, exercise, hobbies, social activities, and academic interests – to study for this exam. This was an unprecedented move on my end, as I had, up to that point in my career, maintained my outside interests while simultaneously preparing for my exams. However, I believed that since this was my last exam, and with no fall exam on the horizon, that I would be able to catch up on these things later.

The good news is that I passed, after having put in about 6 hours of study per day over the course of 100 days. The bad news is that I had put the rest of my life on hold, including my (hopefully) lifelong experiment with spaced repetition, using Anki. For those of you who are new to this, spaced repetition is an optimized technique for memory retention – you can read more about it here. Halting progress on notecard reviews is problematic, for a couple of reasons:

  1. There is no way to pause Anki. Anki will keep scheduling cards even when you aren’t reviewing them, so it can be very difficult to catch up on your reviews, even if you’ve missed just a few days.
  2. Anki schedules cards shortly before you’re about to forget them, which is the best time to review the cards for maximum retention. Because of this, you are likely to forget many of the cards that are on backlog.

Thus, despite the relief I felt over never having to take an actuarial exam ever again, I faced the daunting task of getting back to normal with my Anki reviews. Since I use Anki as a permanent memory bank of sorts, I never delete any of the cards I add – that means I cumulatively review everything I have ever added to my deck over the last five years. This makes the issues I outlined above particularly problematic.

Upon waking up the day after my exam, I discovered that I had over 12,000 cards to review, a backlog which had accumulated over the past three months:

Although I was eager to resume my studies, this backlog would be something I would have to deal with first, since it would be difficult for me to review new material without taking care of the old material first. I assume that most people would simply nuke their collection and start over, but since I had been using Anki for several years, I was confident I’d be able to get through this without having to delete any of my cards.

The first step was to pick the number of reviews I would have to do per day. The tricky part was that if I did too few, the backlog would continue to grow. However, there was no way for me to get through all 12,000 cards within a single day. I settled on starting with 500 reviews per day – a nice, round number that I could easily increase if I noticed I was falling behind.

As the days went by, I recorded the number of reviews I had remaining at the start of each day in a file called cardsleft.csv. The graph below shows that it took about three months to reach a level of about 1,000 cards per day, which was the point at which I declared the backlog to be cleared:

R
1
2
3
4
5
6
7
8
library(tidyverse)
library(RSQLite)
library(rjson)
library(sqldf)
library(treemap)
library(anytime)
library(zoo)
library(reshape2)

R
1
2
3
4
5
6
7
8
9
10
cardsleft <- read.csv("cardsleft.csv", header=TRUE)
cardsleft$date <- as.Date(cardsleft$date, "%m/%d/%y")
 
ggplot(cardsleft, aes(x = date, y = cardsleft)) +
  geom_bar(stat="identity", width = 0.7, fill = "#B3CDE3") +
  ggtitle("Cards Left at the Beginning of Each Day") +
  xlab("Date") +
  ylab("Cards Remaining") +
  theme(plot.title=element_text(size=rel(1.5),vjust=.9,hjust=.5)) +
  guides(fill = guide_legend(reverse = TRUE))

I worked my way through my collection one deck at a time, starting with programming languages, since I wanted to start studying a new JavaScript book as soon as possible. Once that deck was cleared, I started adding new cards pertaining to JavaScript, while simultaneously clearing the backlog in the remaining decks.

That’s all I had to do, and all it took was a bit of consistency and perseverance over three months. Now things are back to normal – I normally review 800 – 1200 cards per day.

Other Spaced Repetition Updates

It’s been a little more than a year since I last wrote about spaced repetition. I’m happy to say that my experiment is still going strong, and my personal goal of never deleting any cards has not placed an undue burden on my livelihood or on my ability to study new material. Since Anki stores its information in a SQLite database, you can directly connect to it with R to analyze its contents.

For the most part, the deck composition by subject has remained similar, but the computer science portion has increased due to my focus on databases, JavaScript, Git, and R:

R
1
2
3
4
5
6
7
8
9
10
11
12
13
14
15
16
17
18
19
20
21
22
23
24
25
26
27
28
29
30
31
32
33
34
35
36
37
38
39
40
41
42
43
con = dbConnect(SQLite(), dbname = "collection.anki2")


con = dbConnect(RSQLite::SQLite(),dbname="collection.anki2")
 
#get reviews
rev <- dbGetQuery(con,'select CAST(id as TEXT) as id
                  , CAST(cid as TEXT) as cid
                  , time
                  from revlog')
 
cards <- dbGetQuery(con,'select CAST(id as TEXT) as cid, CAST(did as TEXT) as did from cards')
 
#Get deck info - from the decks field in the col table
deckinfo <- as.character(dbGetQuery(con,'select decks from col'))
decks <- fromJSON(deckinfo)
 
names <- c()
did <- names(decks)
for(i in 1:length(did))
{
  names[i] <- decks[[did[i]]]$name
}
 
decks <- data.frame(cbind(did,names))
decks$names <- as.character(decks$names)
decks$actuarial <- ifelse(regexpr('[Aa]ctuar',decks$names) > 0,1,0)
decks$category <- gsub(":.*$","",decks$names)
decks$subcategory <- sub("::","/",decks$names)
decks$subcategory <- sub(".*/","",decks$subcategory)
decks$subcategory <- gsub(":.*$","",decks$subcategory)
 
 
cards_w_decks <- merge(cards,decks,by="did")
 
deck_summary <- sqldf("SELECT category, subcategory, count(*) as n_cards from cards_w_decks group by category, subcategory")
treemap(deck_summary,
        index=c("category","subcategory"),
        vSize="n_cards",
        type="index",
        palette = "Set2",
        title="Card Distribution by Category")

In the time that has passed, my deck as grown from about 40,000 cards to 50,000 cards:

R
1
2
3
4
5
6
7
8
9
10
cards$created_date <- as.yearmon(anydate(as.numeric(cards$cid)/1000))
cards_summary <- sqldf("select created_date, count(*) as n_cards from cards group by created_date order by created_date")
cards_summary$deck_size <- cumsum(cards_summary$n_cards)
 
ggplot(cards_summary,aes(x=created_date,y=deck_size))+geom_bar(stat="identity",fill="#B3CDE3")+
  ggtitle("Cumulative Deck Size") +
  xlab("Year") +
  ylab("Number of Cards") +
  theme(plot.title=element_text(size=rel(1.5),vjust=.9,hjust=.5)) +
  guides(fill = guide_legend(reverse = TRUE))

And, thankfully, the proportion of my time preparing for actuarial exams has dropped to near zero:

R
1
2
3
4
5
6
7
8
9
10
11
12
13
14
15
16
17
18
19
20
21
#Date is UNIX timestamp in milliseconds, divide by 1000 to get seconds
rev$revdate <- as.yearmon(anydate(as.numeric(rev$id)/1000))
 
#Assign deck info to reviews
rev_w_decks <- merge(rev,cards_w_decks,by="cid")
rev_summary <- sqldf("select revdate,sum(case when actuarial = 0 then 1 else 0 end) as non_actuarial,sum(actuarial) as actuarial from rev_w_decks group by revdate")
rev_counts <- melt(rev_summary, id.vars="revdate")
names(rev_counts) <- c("revdate","Type","Reviews")
rev_counts$Type <- ifelse(rev_counts$Type=="non_actuarial","Non-Actuarial","Actuarial")
rev_counts <- rev_counts[order(rev(rev_counts$Type)),]
 
rev_counts$Type <- as.factor(rev_counts$Type)
rev_counts$Type <- relevel(rev_counts$Type, 'Non-Actuarial')
 
ggplot(rev_counts,aes(x=revdate,y=Reviews,fill=Type))+geom_bar(stat="identity")+
  scale_fill_brewer(palette="Pastel1",direction=-1)+
  ggtitle("Reviews by Month") +
  xlab("Review Date") +
  scale_x_continuous(breaks = pretty(rev_counts$revdate, n = 6)) +
  theme(plot.title=element_text(size=rel(1.5),vjust=.9,hjust=.5)) +
  guides(fill = guide_legend(reverse = TRUE))

Posted in: Uncategorized

Archives

  • September 2023
  • February 2023
  • January 2023
  • October 2022
  • March 2022
  • February 2022
  • December 2021
  • July 2020
  • June 2020
  • May 2020
  • May 2019
  • April 2019
  • November 2018
  • September 2018
  • August 2018
  • December 2017
  • July 2017
  • March 2017
  • November 2016
  • December 2014
  • November 2014
  • October 2014
  • August 2014
  • July 2014
  • June 2014
  • February 2014
  • December 2013
  • October 2013
  • August 2013
  • July 2013
  • June 2013
  • March 2013
  • January 2013
  • November 2012
  • October 2012
  • September 2012
  • August 2012
  • July 2012
  • June 2012
  • May 2012
  • April 2012
  • March 2012
  • February 2012
  • January 2012
  • December 2011
  • September 2011
  • August 2011
  • July 2011
  • June 2011
  • January 2011
  • December 2010
  • October 2010
  • September 2010
  • August 2010
  • June 2010
  • May 2010
  • April 2010
  • March 2010
  • September 2009
  • August 2009
  • May 2009
  • December 2008

Categories

  • Actuarial
  • Cycling
  • Logs
  • Mathematics
  • MIES
  • Music
  • Uncategorized

Links

Cyclingnews
Jason Lee
Knitted Together
Megan Turley
Shama Cycles
Shama Cycles Blog
South Central Collegiate Cycling Conference
Texas Bicycle Racing Association
Texbiker.net
Tiffany Chan
USA Cycling
VeloNews

Texas Cycling

Cameron Lindsay
Jacob Dodson
Ken Day
Texas Cycling
Texas Cycling Blog
Whitney Schultz
© Copyright 2025 - Gene Dan's Blog
Infinity Theme by DesignCoral / WordPress