A few things have happened since this last time I’ve posted about a technical subject – I have gotten into contact with Brian Fannin over at the CAS and now have two projects hosted on their GitHub page – PCDM, which I wrote about a couple years ago, and FASLR, a new project I started last year, which I’ll be talking about today.
FASLR (pronounced fæzlɹ̩), is a GUI wrapper built using the PyQt framework to accommodate open-source actuarial reserving engines, such as the chainladder packages written in Python and R.
OK. The buzzword-free version of that sentence is that FASLR is open-source software that is intended to help actuaries do reserving with buttons, windows, and mouse clicks. There are a few open-source packages that let actuaries do reserving by writing programs, and some commercial solutions that let actuaries do reserving with buttons and mouse clicks. But at least to my knowledge, there had yet to be an open-source interface-based software for doing reserving, so I decided to make one. What motivated me to start was I have been wanting to build graphical interfaces for my other projects, such as MIES, but hadn’t made a decision whether to use web-based technologies like Django (letting people use the software in the browser) or something desktop-based like PyQt. I have decided on using PyQt since that would require me to learn fewer languages or deal with browser stuff like JavaScript.
FASLR stands for Free Actuarial System for Loss Reserving, named after Fazlur Rahman Khan, an architect who designed a number of famous buildings in Chicago.
Other motivations include:
- Giving me an excuse to learn PyQt
- Increasing transparency on how actuarial computations are done
- Giving students a window into how actuarial work is done in practice as opposed to exams
- Increasing accessibility of actuarial software to the general public
- Making a GUI compatible with existing open-source technologies
- Imposing my worldview on how actuarial models should be built and implemented in the workplace
- Bragging rights on the CAS GitHub page
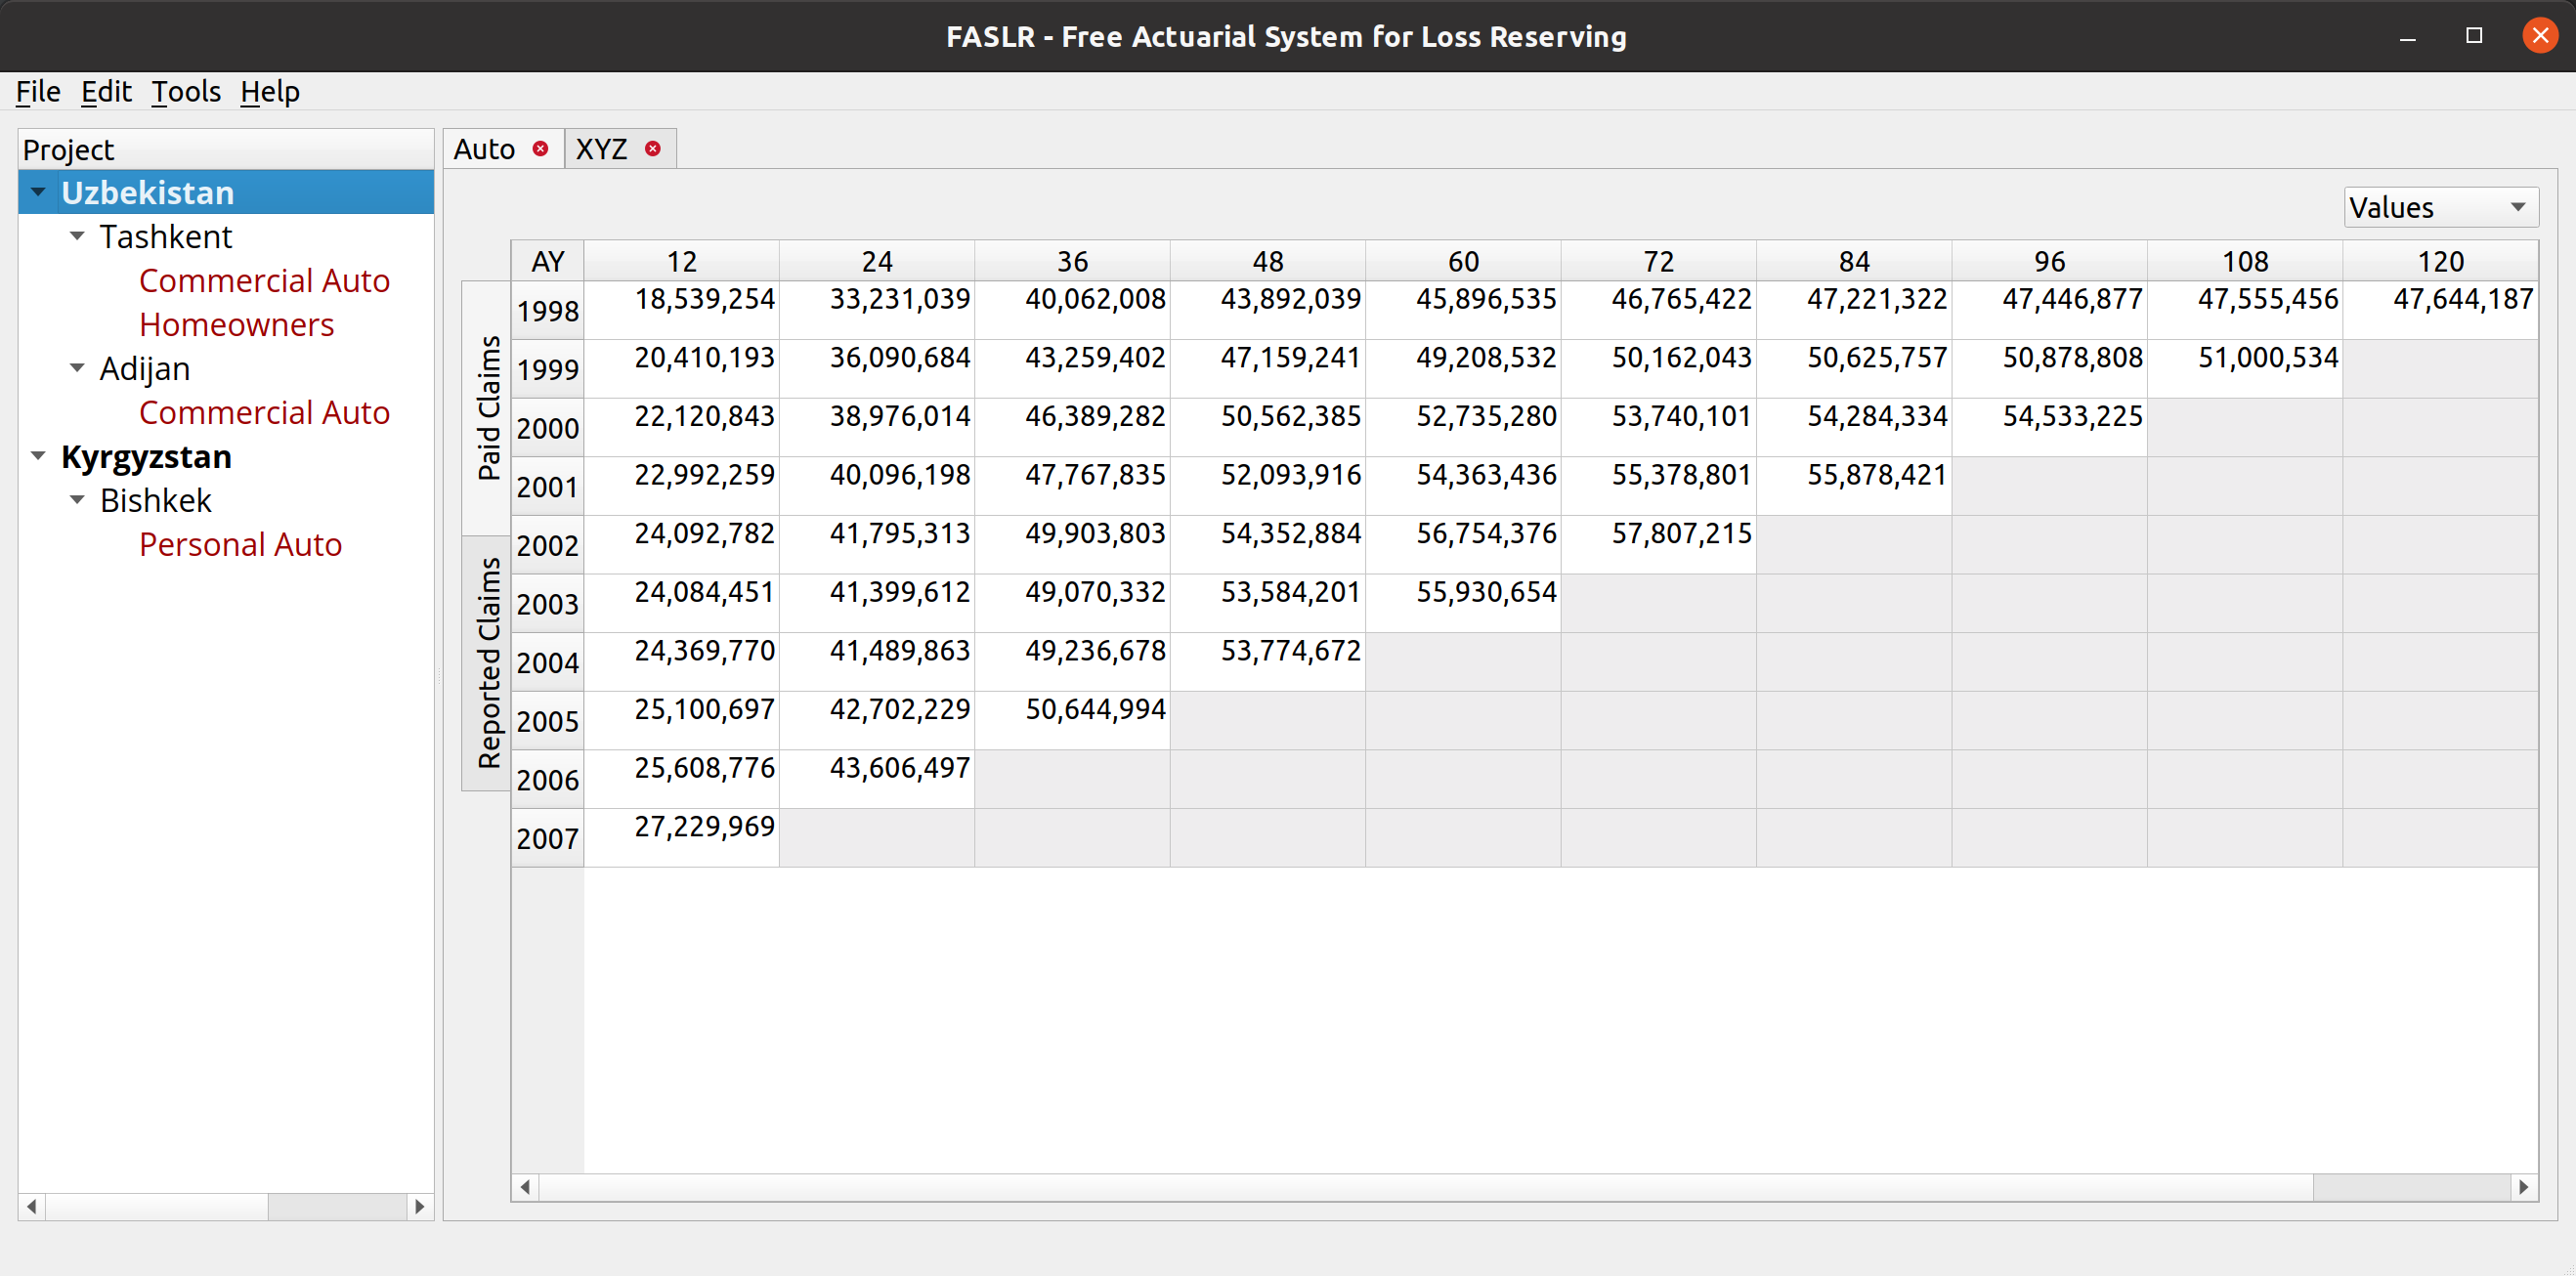
FASLR basic interface
The Chainladder Packages
Chainladder is a fancy word for one of the techniques that actuaries use to guess how much money insurance companies need to pay for claims. It’s also the name of a pair of open-source actuarial packages – one written in R, and another in Python. The R library was written many years ago by Markus Gesmann. It seems to have been written starting around 2007, which is the year of the earliest release I have been able to find on CRAN. The Python package is a port of the R library, written by John S Bogaardt starting around 2017 or so based on the commit history. These packages, by being open-source, have not only helped to improve transparency to how actuarial computations are done but have also improved accessibility to the field by being available to people who do not have the means to pay for commercial software, such as students looking to get into the field. However, since they are lightweight libraries, actuaries must write programs to do reserving – which, depending on personal preference, may or may not be the most productive way to get reserving done.
I think that last sentence is a fair criticism of using a programming language to get actuarial work done – especially when we consider the selection of development factors, the topic of today’s post. This isn’t to disparage these packages – both of which are major contributions to modernizing actuarial science. And thanks to John, pretty much 75% of the work is already done to get FASLR working – all I have to do is design the interface (unlike MIES, which will take forever to be ready). It is their work that makes something like FASLR possible. On the subject of development factors – this is a family of various averages of age-to-age factors used to develop losses to ultimate. When you use a package, you might need to write a line of code picking out which link ratios you want to exclude and then visualize the resulting averages by executing another line. If you didn’t like your selection, you may have to edit that line of code or write a new one and recompute – over and over again. That may be tedious, and hard to keep track of if you have several attempts. However, if you could simply double-click on a triangle of link ratios to exclude them and see the factors update in near-real time, you can get your work done a lot faster.
Below is an example (taken from the Chainladder documentation) of how we can use Chainladder to load a sample triangle and see the link ratios:
|
1 2 3 4 5 |
import chainladder as cl genins = cl.load_sample("genins") print(genins.link_ratio) |
|
1 2 3 4 5 6 7 8 9 10 |
12-24 24-36 36-48 48-60 60-72 72-84 84-96 96-108 108-120 2001 3.143200 1.542806 1.278299 1.237719 1.209207 1.044079 1.040374 1.063009 1.017725 2002 3.510582 1.755493 1.545286 1.132926 1.084493 1.128106 1.057268 1.086496 NaN 2003 4.448450 1.716718 1.458257 1.232079 1.036860 1.120010 1.060577 NaN NaN 2004 4.568002 1.547052 1.711784 1.072518 1.087360 1.047076 NaN NaN NaN 2005 2.564198 1.872956 1.361545 1.174217 1.138315 NaN NaN NaN NaN 2006 3.365588 1.635679 1.369162 1.236443 NaN NaN NaN NaN NaN 2007 2.922798 1.878099 1.439393 NaN NaN NaN NaN NaN NaN 2008 3.953288 2.015651 NaN NaN NaN NaN NaN NaN NaN 2009 3.619179 NaN NaN NaN NaN NaN NaN NaN NaN |
And to view the volume-weighted LDFs for all years, we execute:
|
1 2 3 |
vol = cl.Development(average="volume").fit(genins).ldf_ print(vol) |
|
1 2 |
12-24 24-36 36-48 48-60 60-72 72-84 84-96 96-108 108-120 (All) 3.490607 1.747333 1.457413 1.173852 1.103824 1.086269 1.053874 1.076555 1.017725 |
Now, to exclude certain periods, we can pass a list of excluded periods to the .Development() method:
|
1 2 3 |
ldfs_w_dropped = cl.Development(drop=[("2004", 12), ("2008", 24)]).fit(genins).ldf_ print(ldfs_w_dropped) |
|
1 2 |
12-24 24-36 36-48 48-60 60-72 72-84 84-96 96-108 108-120 (All) 3.379677 1.704149 1.457413 1.173852 1.103824 1.086269 1.053874 1.076555 1.017725 |
We can see that this has altered the 12-24 and 24-36 LDFs.
However, actuaries typically want to experiment with several exclusions with trial and error, so a GUI would be helpful here.
FASLR Example
I will now give a demo of how FASLR uses the Chainladder methods above to speed up LDF selection via a GUI. Below is an example of a window I designed to display a triangle of link ratios with the volume-weighted LDFs right below the triangle:
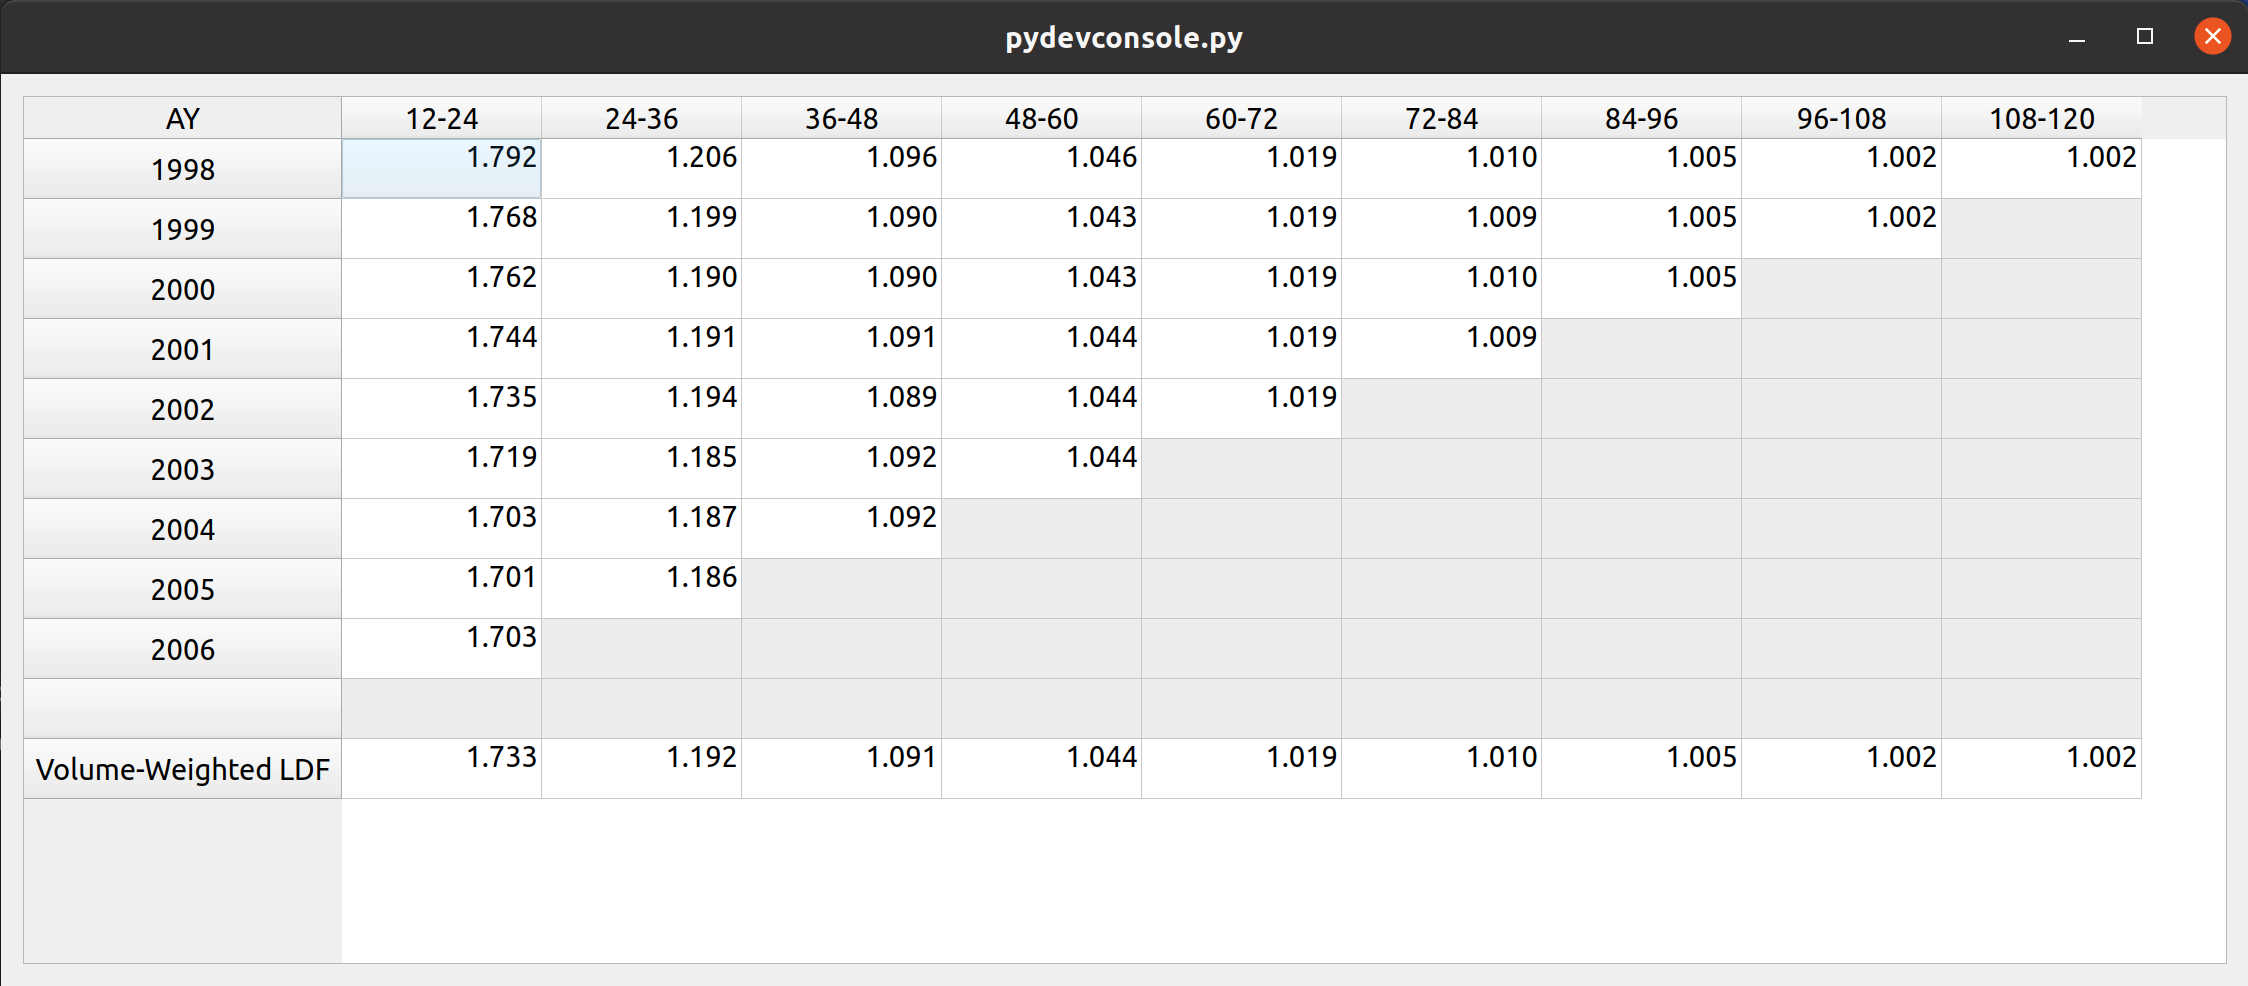
What I’d like to do is double-click a factor to exclude it. Ideally this will get the LDFs at the bottom to update immediately so I can see the results – without having to do all the typing we did with the Chainladder example. I have written FASLR to update the formatting of the link ratio to be struck-out with a pink background to indicate exclusion. Below are the first three accident years of the 12-24 column excluded.
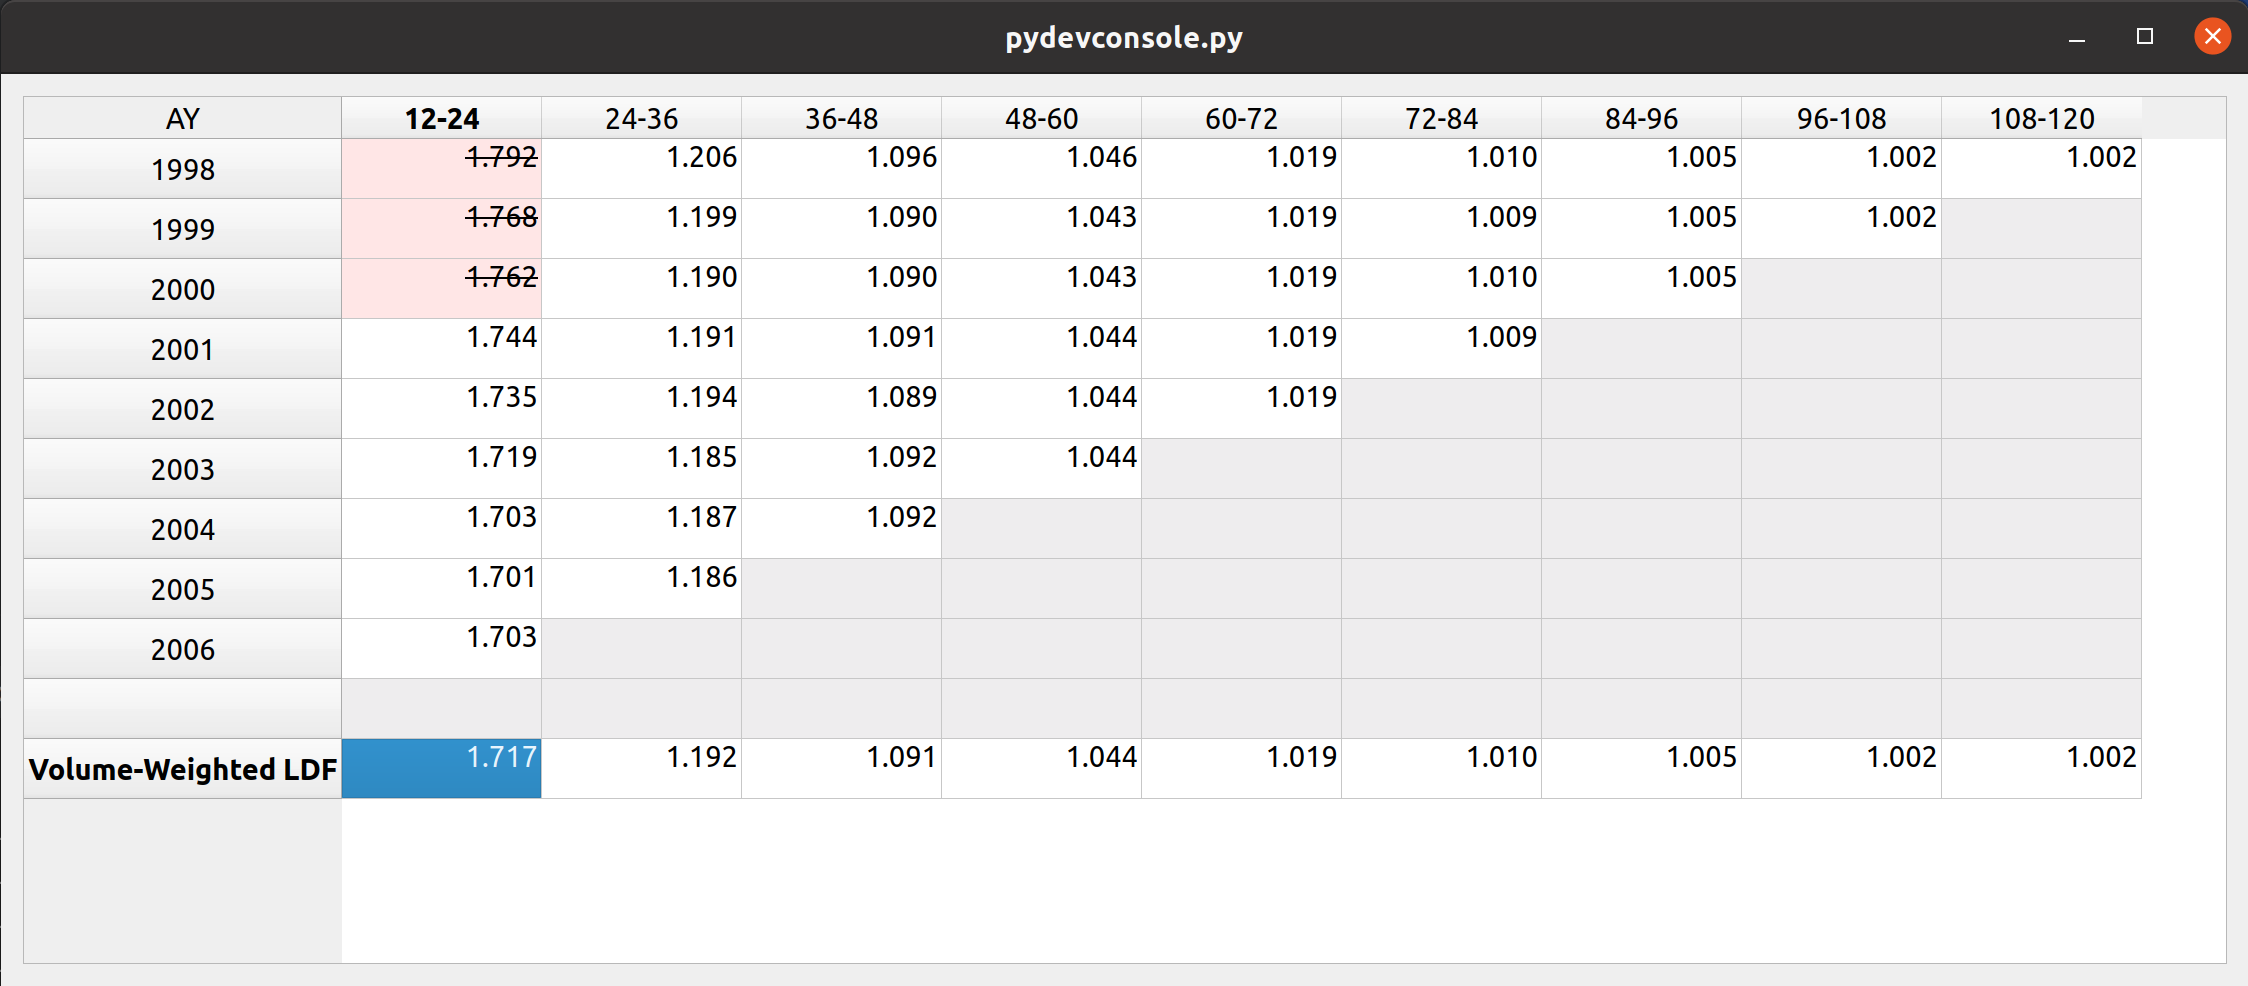
You can see that the formatting has now updated with the first ldf changed from 1.733 to 1.717.
The GIF below demonstrates how fast we can preview the LDF changes using this feature:
The demo can be run from the FASLR source code, available on the CAS GitHub page.
This is just one feature preview out of what I hope will be many, so keep an eye open for future updates.
Technical Appendix
This was all much easier said than done. Getting that factor elimination feature to work was tricky, especially with me being new to PyQt and all. This feature makes use of a concept called Model-View-Controller which you can read more about here. Below is some example code from the FASLR module that does most of the work that we see in today’s post. It depends on all the other modules in the repository, so I don’t expect a full understanding from the code listing alone. To find out more, refer to the entire source code:
|
1 2 3 4 5 6 7 8 9 10 11 12 13 14 15 16 17 18 19 20 21 22 23 24 25 26 27 28 29 30 31 32 33 34 35 36 37 38 39 40 41 42 43 44 45 46 47 48 49 50 51 52 53 54 55 56 57 58 59 60 61 62 63 64 65 66 67 68 69 70 71 72 73 74 75 76 77 78 79 80 81 82 83 84 85 86 87 88 89 90 91 92 93 94 95 96 97 98 99 100 101 102 103 104 105 106 107 108 109 110 111 112 113 114 115 116 117 118 119 120 121 122 123 124 125 126 127 128 129 130 131 132 133 134 135 136 137 138 139 140 141 142 143 144 145 146 147 148 149 150 151 152 153 154 155 156 157 158 159 160 161 162 163 164 165 166 167 168 169 170 171 172 173 174 175 176 177 178 179 180 181 182 183 184 185 186 187 188 189 190 191 192 193 194 195 196 197 198 199 200 201 202 203 204 205 206 207 208 209 210 211 212 213 214 215 216 217 218 219 220 221 222 223 224 225 226 227 228 229 230 231 232 233 234 235 236 237 238 239 240 241 242 243 244 245 246 247 248 249 250 251 252 253 254 255 256 257 258 259 260 261 262 263 264 265 266 267 268 269 270 271 272 273 274 275 276 277 278 279 280 281 282 283 284 285 286 287 288 289 290 291 292 293 294 295 296 297 298 299 300 301 302 303 304 305 306 307 308 309 310 311 312 313 314 315 316 317 318 319 320 321 322 323 324 325 326 327 328 329 330 331 |
import chainladder as cl import csv import io import numpy as np import pandas as pd from chainladder import Triangle from pandas import DataFrame from PyQt5.QtCore import ( QAbstractTableModel, QEvent, Qt, QSize, QVariant ) from PyQt5.QtGui import ( QColor, QFont, QKeySequence ) from PyQt5.QtWidgets import ( QAbstractButton, QAction, QApplication, qApp, QLabel, QMenu, QStyle, QStylePainter, QStyleOptionHeader, QTableView, QVBoxLayout ) from style.triangle import ( BLANK_TEXT, LOWER_DIAG_COLOR, RATIO_STYLE, VALUE_STYLE ) class FactorModel(QAbstractTableModel): def __init__( self, triangle: Triangle, value_type: str = "ratio" ): super( FactorModel, self ).__init__() self.triangle = triangle self._data = triangle.link_ratio.to_frame() self.link_frame = triangle.link_ratio.to_frame() self.n_rows = self.rowCount() self.development_factors = cl.Development(average="volume").fit(self.triangle) self._data = get_display_data( ratios=self.link_frame, factors=self.development_factors ) self.value_type = value_type self.excl_frame = self._data.copy() self.excl_frame.loc[:] = False self.blank_row_num = self.n_rows + 1 def data( self, index, role=None ): if role == Qt.DisplayRole: value = self._data.iloc[index.row(), index.column()] # Display blank when there are nans in the lower-right hand of the triangle. if str(value) == "nan": display_value = BLANK_TEXT else: # "value" means stuff like losses and premiums, should have 2 decimal places. if self.value_type == "value": display_value = VALUE_STYLE.format(value) # for "ratio", want to display 3 decimal places. else: display_value = RATIO_STYLE.format(value) display_value = str(display_value) self.setData( self.index( index.row(), index.column() ), QVariant(Qt.AlignRight), Qt.TextAlignmentRole ) return display_value if role == Qt.TextAlignmentRole: return Qt.AlignRight if role == Qt.BackgroundRole: if (index.column() >= self.n_rows - index.row()) and \ (index.row() < self.blank_row_num): return LOWER_DIAG_COLOR elif index.row() < self.blank_row_num: exclude = self.excl_frame.iloc[[index.row()], [index.column()]].squeeze() if exclude: return QColor(255, 230, 230) else: return QColor(255, 255, 255) if (role == Qt.FontRole) and (self.value_type == "ratio") and (index.row() < self.blank_row_num): font = QFont() exclude = self.excl_frame.iloc[[index.row()], [index.column()]].squeeze() if exclude: font.setStrikeOut(True) else: font.setStrikeOut(False) return font def rowCount( self, parent=None, *args, **kwargs ): return self._data.shape[0] def columnCount( self, parent=None, *args, **kwargs ): return self._data.shape[1] def headerData( self, p_int, qt_orientation, role=None ): # section is the index of the column/row. if role == Qt.DisplayRole: if qt_orientation == Qt.Horizontal: return str(self._data.columns[p_int]) if qt_orientation == Qt.Vertical: return str(self._data.index[p_int]) def toggle_exclude(self, index): exclude = self.excl_frame.iloc[[index.row()], [index.column()]].squeeze() if exclude: self.excl_frame.iloc[[index.row()], [index.column()]] = False else: self.excl_frame.iloc[[index.row()], [index.column()]] = True def recalculate_factors(self, index): drop_list = [] for i in range(self.link_frame.shape[0]): for j in range(self.link_frame.shape[1]): exclude = self.excl_frame.iloc[[i], [j]].squeeze() print(exclude) if exclude: row_drop = str(self.link_frame.iloc[i].name) col_drop = int(str(self.link_frame.columns[j]).split('-')[0]) drop_list.append((row_drop, col_drop)) else: pass development = cl.Development(drop=drop_list, average="volume") self.development_factors = development.fit(self.triangle) self._data = get_display_data( ratios=self.link_frame, factors=self.development_factors ) # print(development.fit_transform(self.triangle).link_ratio) print(self._data) self.dataChanged.emit(index, index) self.layoutChanged.emit() class FactorView(QTableView): def __init__(self): super().__init__() self.copy_action = QAction("&Copy", self) self.copy_action.setShortcut(QKeySequence("Ctrl+c")) self.copy_action.setStatusTip("Copy selection to clipboard.") # noinspection PyUnresolvedReferences self.copy_action.triggered.connect(self.copy_selection) self.installEventFilter(self) btn = self.findChild(QAbstractButton) btn.installEventFilter(self) btn_label = QLabel("AY") btn_label.setAlignment(Qt.AlignCenter) btn_layout = QVBoxLayout() btn_layout.setContentsMargins(0, 0, 0, 0) btn_layout.addWidget(btn_label) btn.setLayout(btn_layout) opt = QStyleOptionHeader() # Set the styling for the table corner so that it matches the rest of the headers. self.setStyleSheet( """ QTableCornerButton::section{ border-width: 1px; border-style: solid; border-color:none darkgrey darkgrey none; } """ ) s = QSize(btn.style().sizeFromContents( QStyle.CT_HeaderSection, opt, QSize(), btn). expandedTo(QApplication.globalStrut())) if s.isValid(): self.verticalHeader().setMinimumWidth(s.width()) self.verticalHeader().setDefaultAlignment(Qt.AlignCenter) self.doubleClicked.connect(self.exclude_ratio) def exclude_ratio(self): selection = self.selectedIndexes() for index in selection: index.model().toggle_exclude(index=index) index.model().recalculate_factors(index=index) def eventFilter(self, obj, event): if event.type() != QEvent.Paint or not isinstance( obj, QAbstractButton): return False # Paint by hand (borrowed from QTableCornerButton) opt = QStyleOptionHeader() opt.initFrom(obj) style_state = QStyle.State_None if obj.isEnabled(): style_state |= QStyle.State_Enabled if obj.isActiveWindow(): style_state |= QStyle.State_Active if obj.isDown(): style_state |= QStyle.State_Sunken opt.state = style_state opt.rect = obj.rect() # This line is the only difference to QTableCornerButton opt.text = obj.text() opt.position = QStyleOptionHeader.OnlyOneSection painter = QStylePainter(obj) painter.drawControl(QStyle.CE_Header, opt) return True def contextMenuEvent(self, event): """ When right-clicking a cell, activate context menu. :param: event :return: """ menu = QMenu() menu.addAction(self.copy_action) menu.exec(event.globalPos()) def copy_selection(self): """Method to copy selected values to clipboard, so they can be pasted elsewhere, like Excel.""" selection = self.selectedIndexes() if selection: rows = sorted(index.row() for index in selection) columns = sorted(index.column() for index in selection) rowcount = rows[-1] - rows[0] + 1 colcount = columns[-1] - columns[0] + 1 table = [[''] * colcount for _ in range(rowcount)] for index in selection: row = index.row() - rows[0] column = index.column() - columns[0] table[row][column] = index.data() stream = io.StringIO() csv.writer(stream, delimiter='\t').writerows(table) qApp.clipboard().setText(stream.getvalue()) return def get_display_data(ratios, factors: DataFrame): data = {"": [np.nan] * len(ratios.columns)} blank_row = pd.DataFrame.from_dict( data, orient="index", columns=ratios.columns ) factor_frame = factors.ldf_.to_frame() factor_frame = factor_frame.rename(index={'(All)': 'Volume-Weighted LDF'}) return pd.concat([ratios, blank_row, factor_frame]) |