Today marks an exciting milestone – FASLR (Free Actuarial System for Loss Reserving) – has now implemented its first reserving technique, the chain ladder method. This makes it a good time to update the version number for the project, so I’ve bumped it from its inception v0.0.0 to v0.0.1. Feel free to check out the source code on the CAS GitHub.
New features added:
- Ultimate Loss Column calculated via the chain ladder technique
- Rows for selected LDFs and CDFs
- The ability to select LDFs by double-clicking averages
- Dialog box for creating and storing custom link ratio average types
- Link ratio heatmap
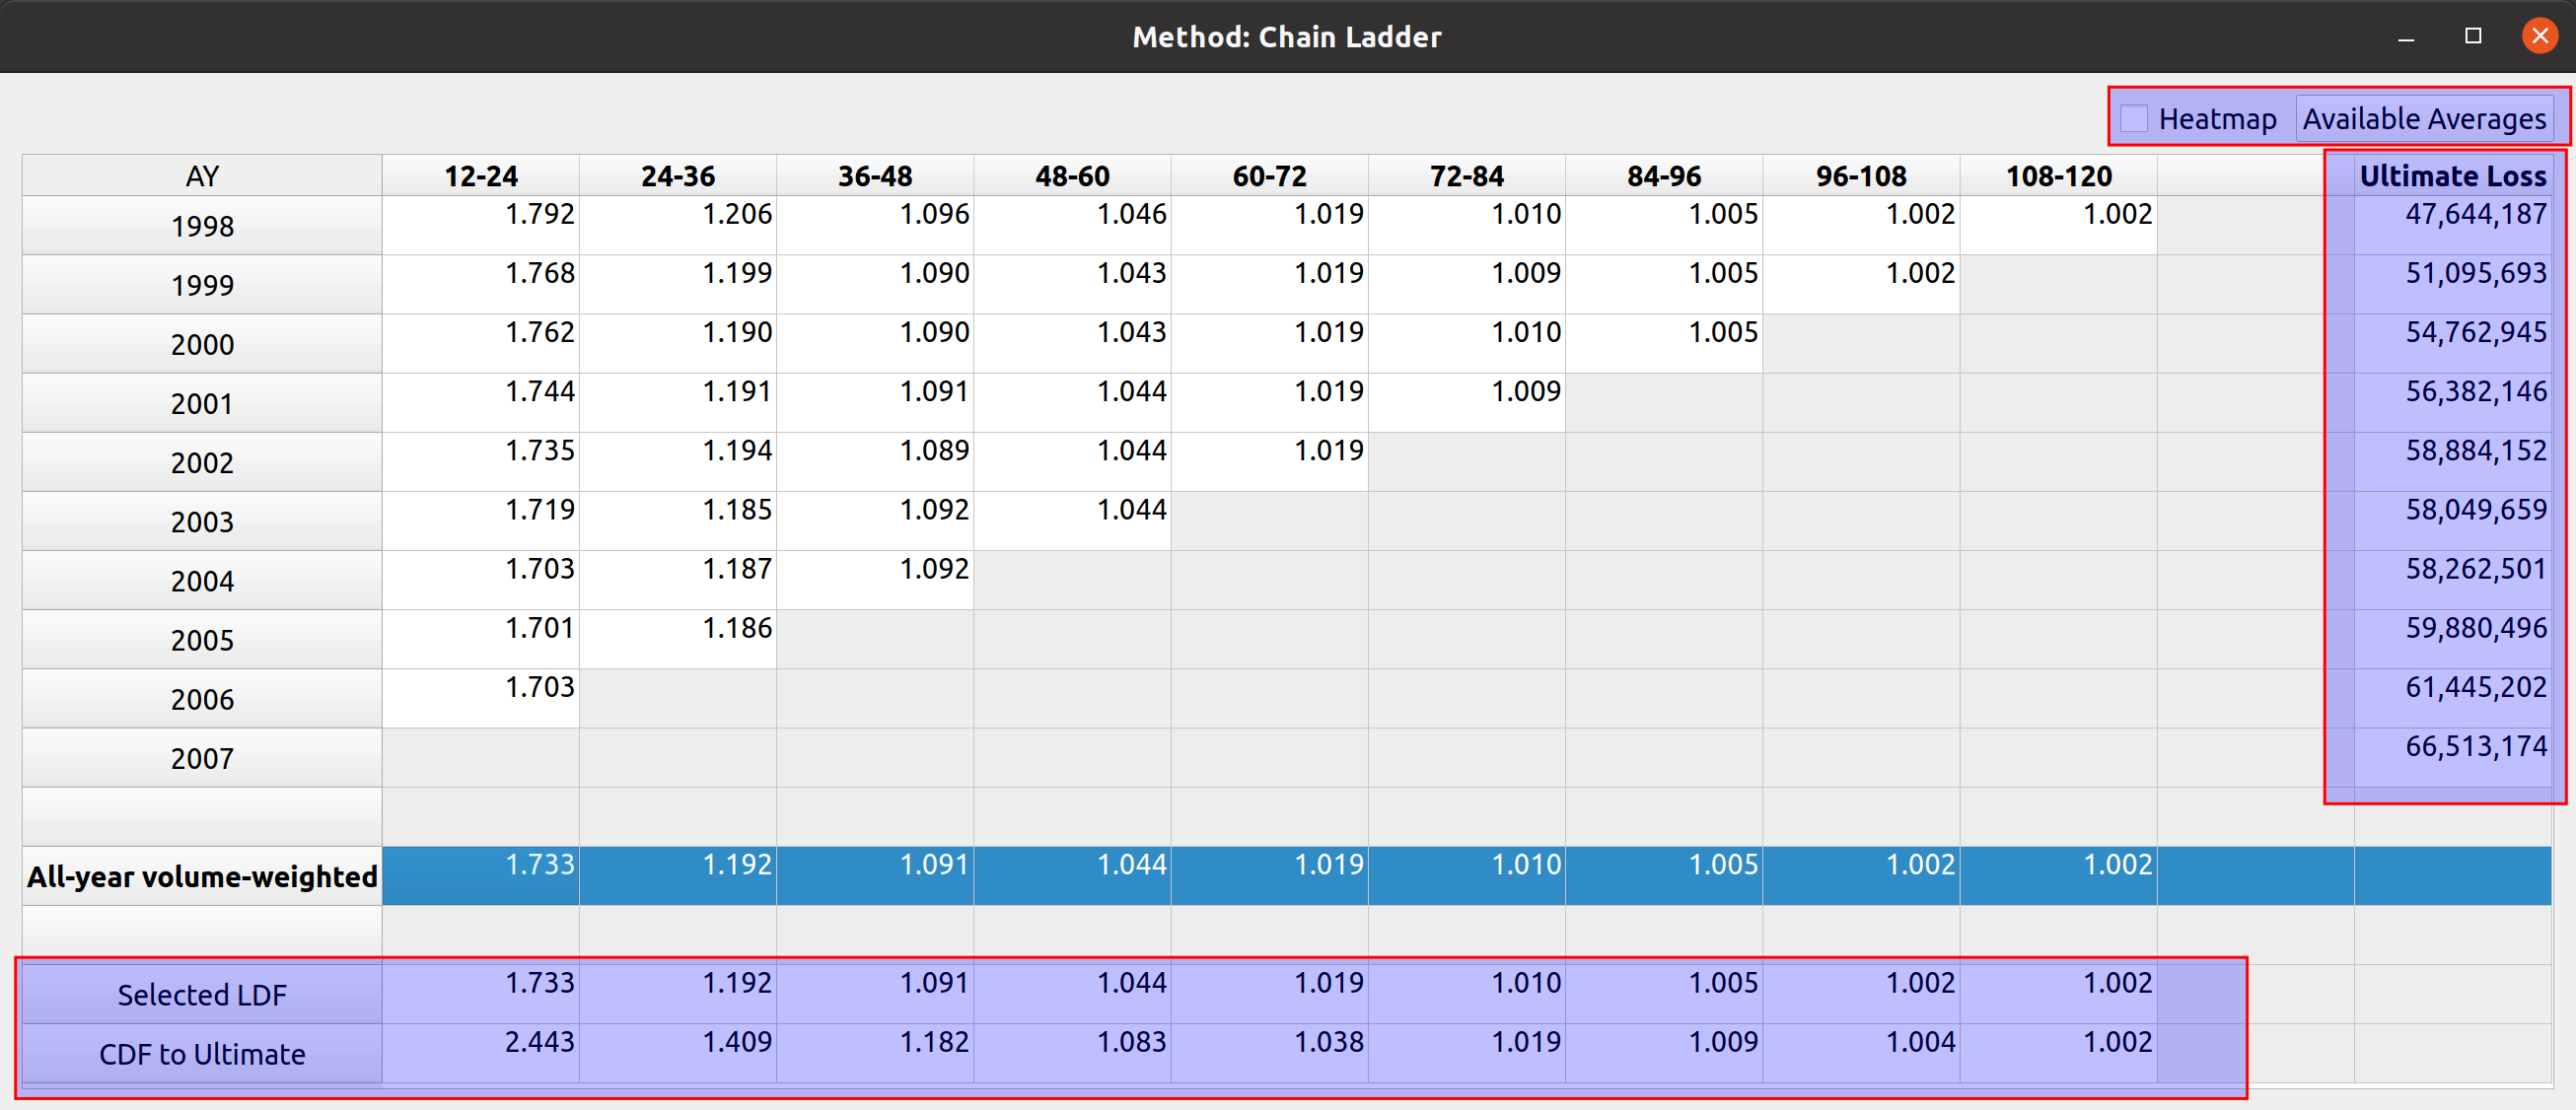
These features have been added to the development factor view of FASLR. The images below show a comparison to how it looked last month (first image) vs. how it looks now, with the new features highlighted in red boxes (second image):
Project Status
When examining the views of the repo, I’ve seen a lot of people taking a look at the releases section, the setup.py file, and the documentation. This leads me to believe that some people either think this is an installable program or are checking to see if it is. Right now, the project exists as a collection of Python source code files, so it’s not there yet. I do have plans to eventually release installable binaries where you can just double click a file and have it installed on your operating system. But first, I would have to learn how to do that and I have yet to decide on which tool I want to use to make that happen (GNU Make, Bazel, fbs, pyinstaller, etc.). This will be a new skill for me to acquire so it will take some time.
If you do want to run FASLR, you can execute the file main.py in the shell. This will give you access to the main GUI window and project pane. Currently, I’m focused on setting up views for the various reserving methodologies, once I’ve either exhausted those available in the chainladder package, or reached a point where it would be nice to integrate them into the main window, I will begin to focus more on the reserving project methodology – i.e., making it possible to start from data importation and end with a reserving estimate.
Versioning Methodology
The versioning system consists of a three-part format: v#.#.#. The rightmost digit represents unstable versions. Excluding v0.0.0, if your installation happens to have a rightmost digit other than 0, you can assume that you are using the software for the purpose of testing out the latest features and not relying on stability. The middle digit represents stable releases, meaning that the features have been tested to the best of the ability of the developer(s) and provide a reasonable level of reliability. So something like v0.1.0 would represent the first stable version and v0.1.1 would represent the most recent unstable version released after v0.1.0. The next stable version after v0.1.0 will be v0.2.0.
The leftmost digit represents major cultural milestones in the project. Right now it seems to be in vogue to reserve version 1.whatever for a special occasion, to mark the point where the software has become the de-facto open-source standard for performing work in the field. I will adopt this convention for this project, but while I have no plans to ever reach this point, as FASLR is mostly a learning exercise for me, it would be a nice point to reach if it ever gains traction.
Ultimate Losses
Since there are numerous sources on actuarial reserving methods which can do a much better job of explaining how they work than I can, I won’t spend much detail here on them and you can always refer back to CAS Exam 5 papers if you are not familiar with them. These next few sections will start with a blank factor view, and I will gradually demonstrate how link ratio averages can be used, in combination with the chain ladder technique to project ultimate loss.
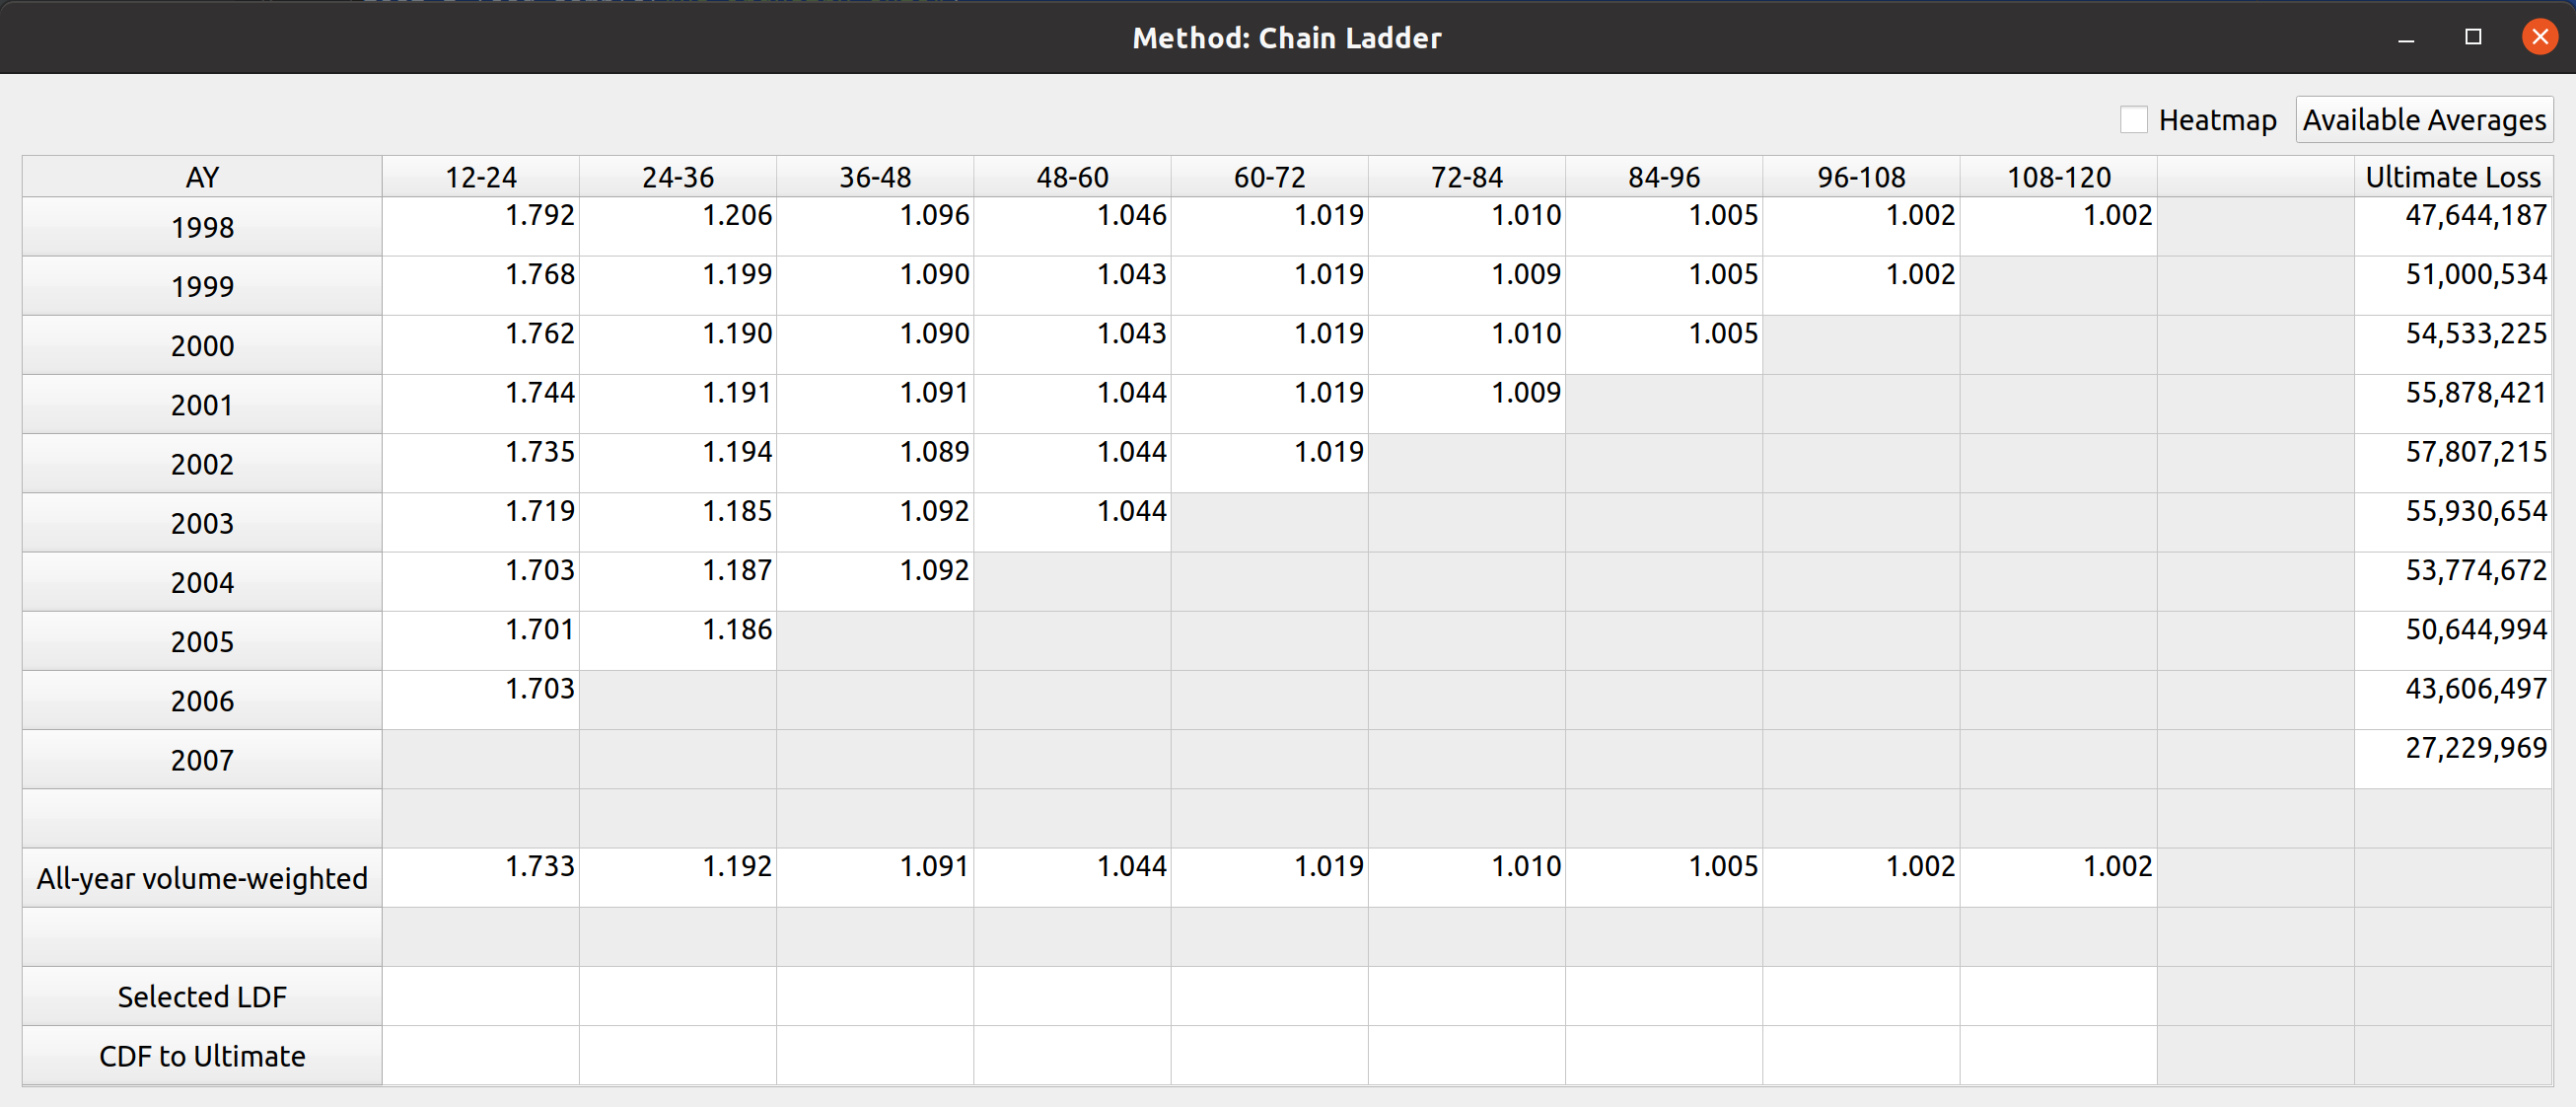
One purpose of actuarial reserving is to estimate the liabilities per unit of time (such as accident year) and we call this estimate the ultimate loss. Therefore, one of my goals for this month was to add a column for ultimate loss. Below shows the (mostly) blank factor view with the link ratio triangle and ultimate loss column to the right. The LDFs have not been selected, and the chainladder package defaults non-selection to 1.000:
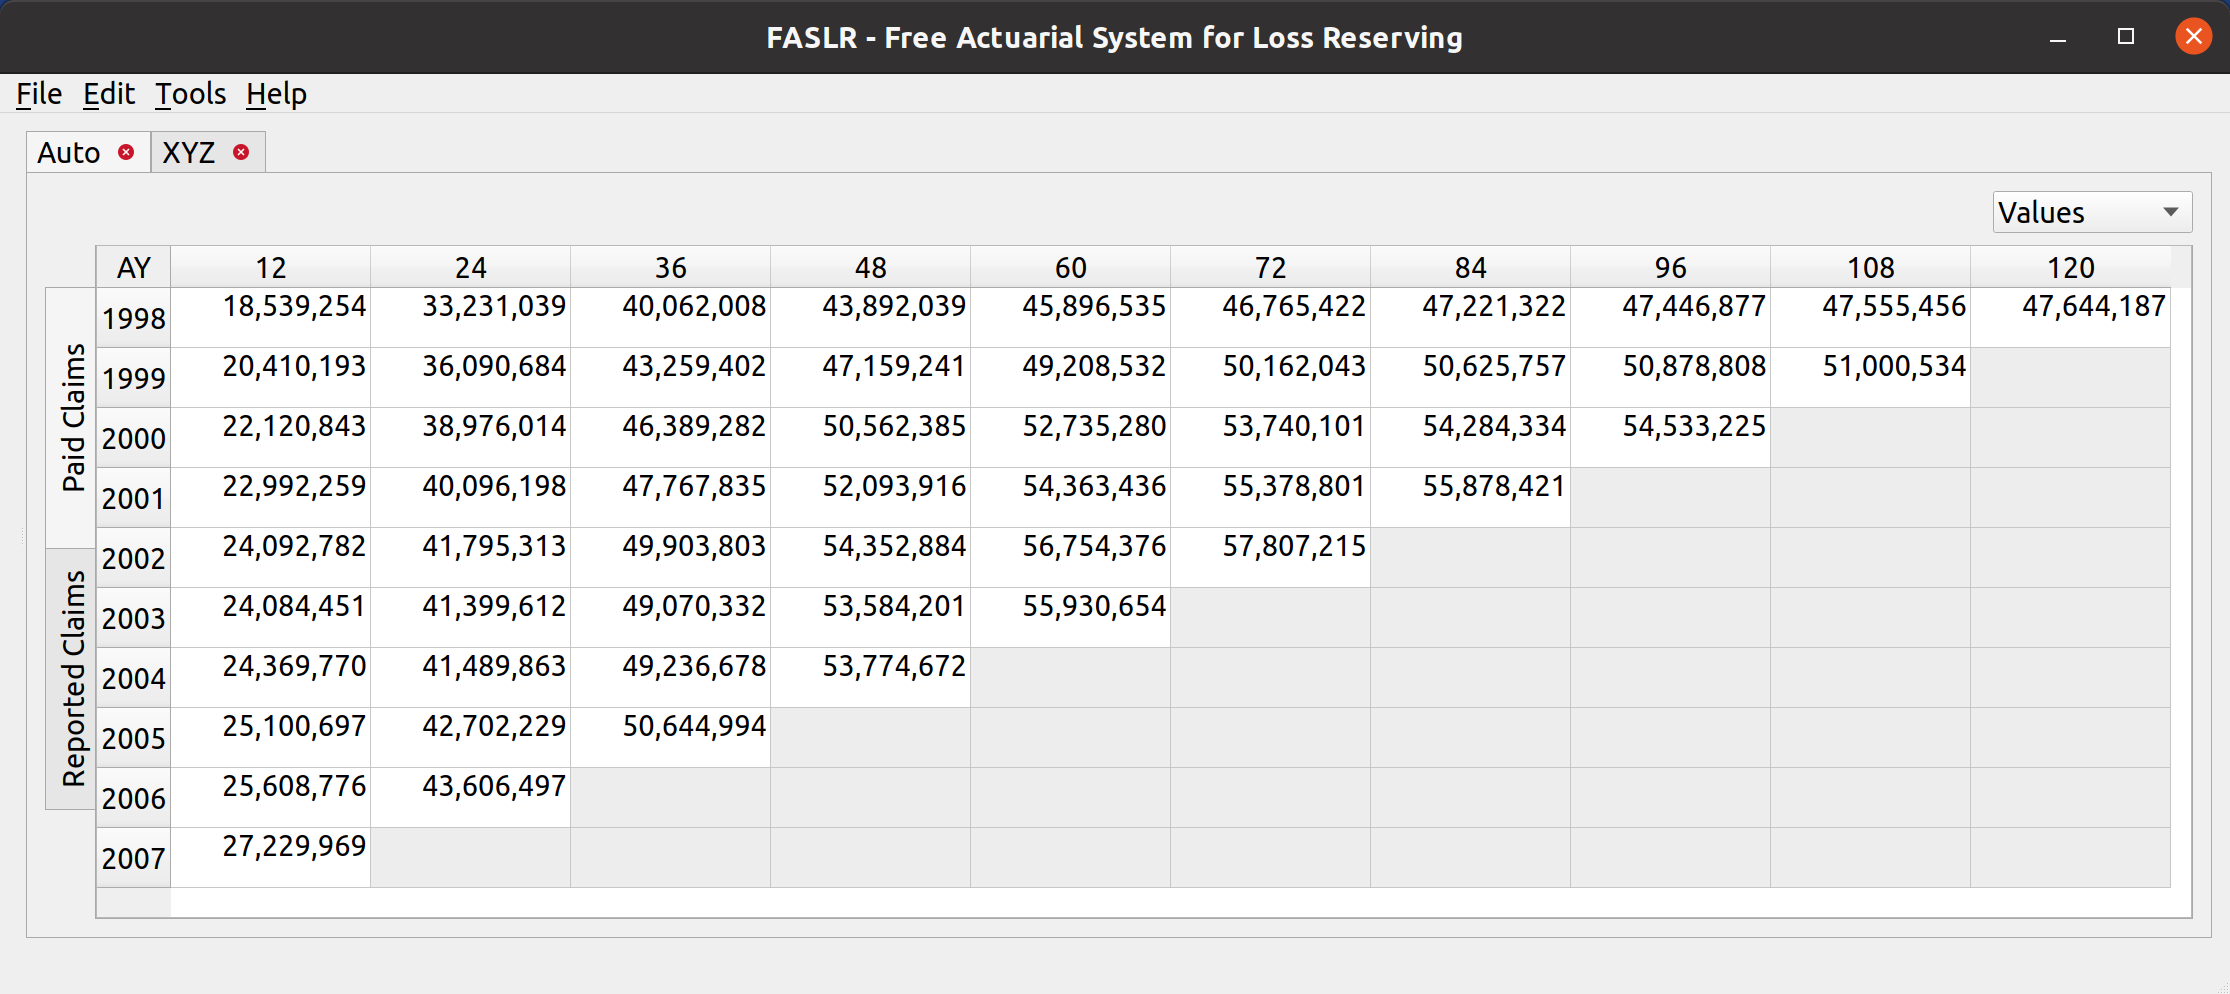
You can confirm that the starting LDFs are 1.000 by looking at the source triangle – the ultimate loss values are the same as the latest diagonal:
LDF Selection
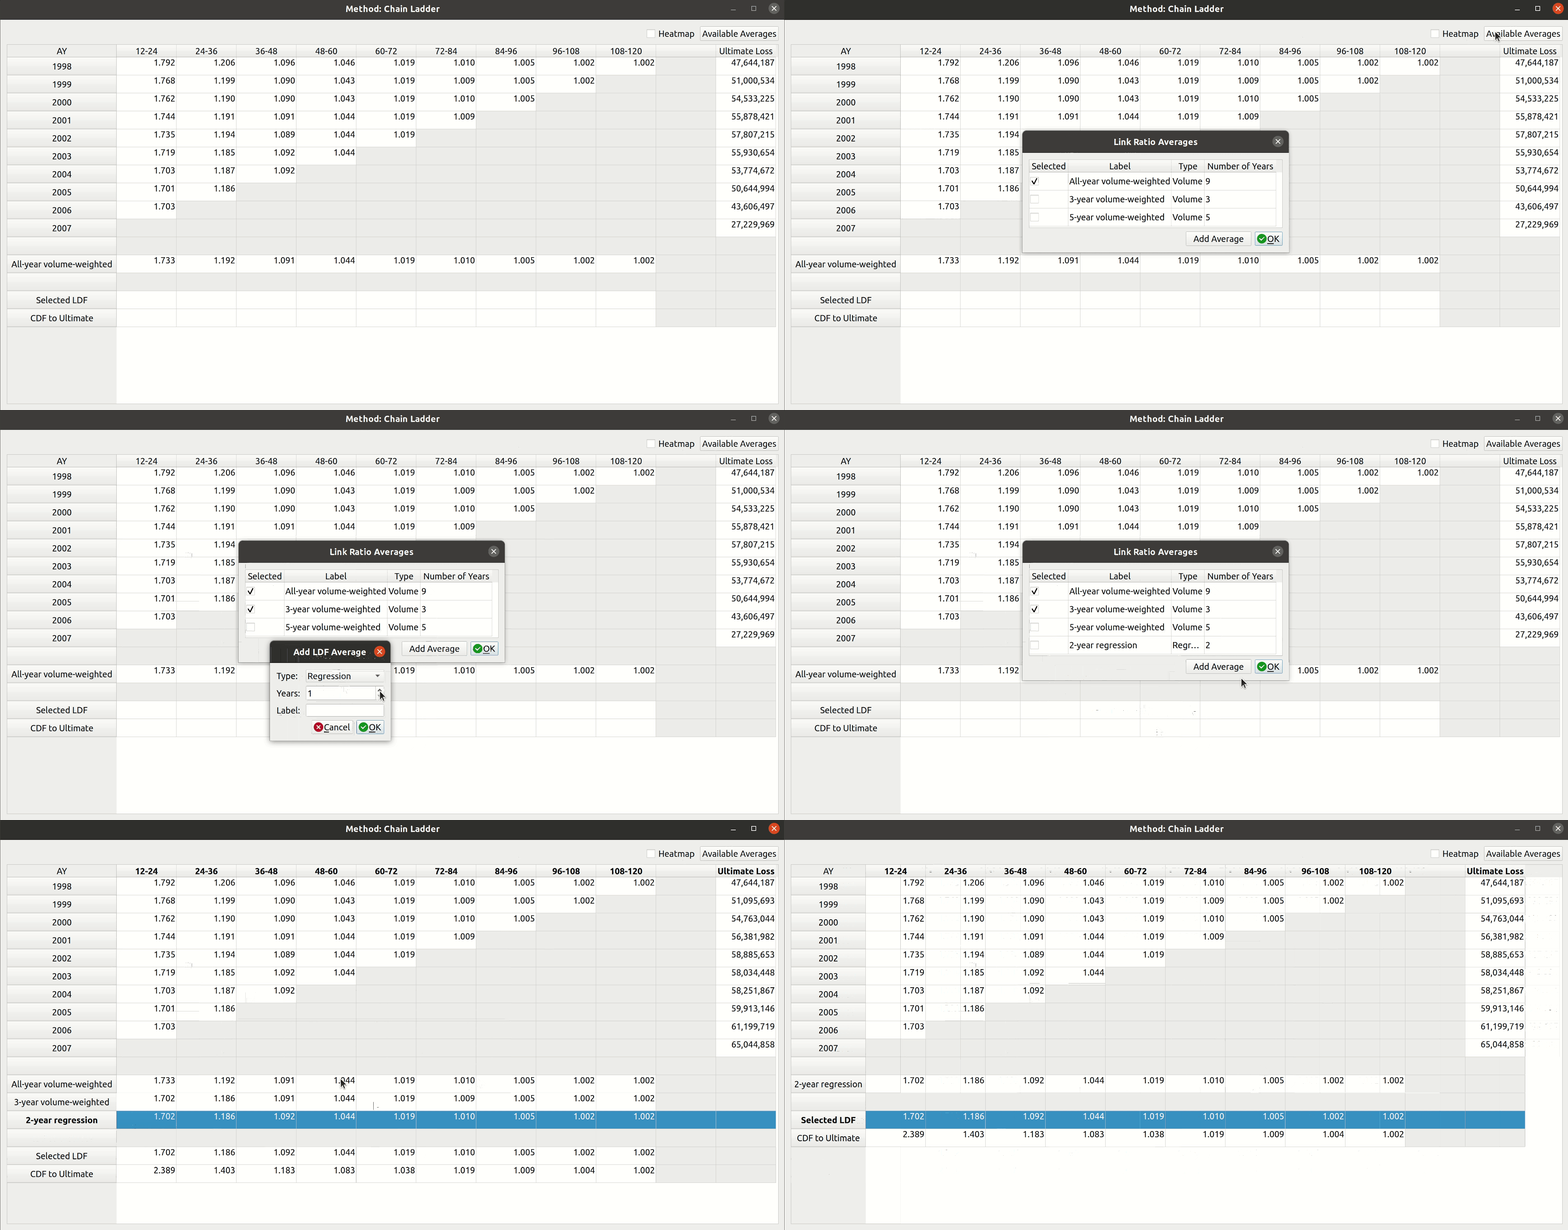
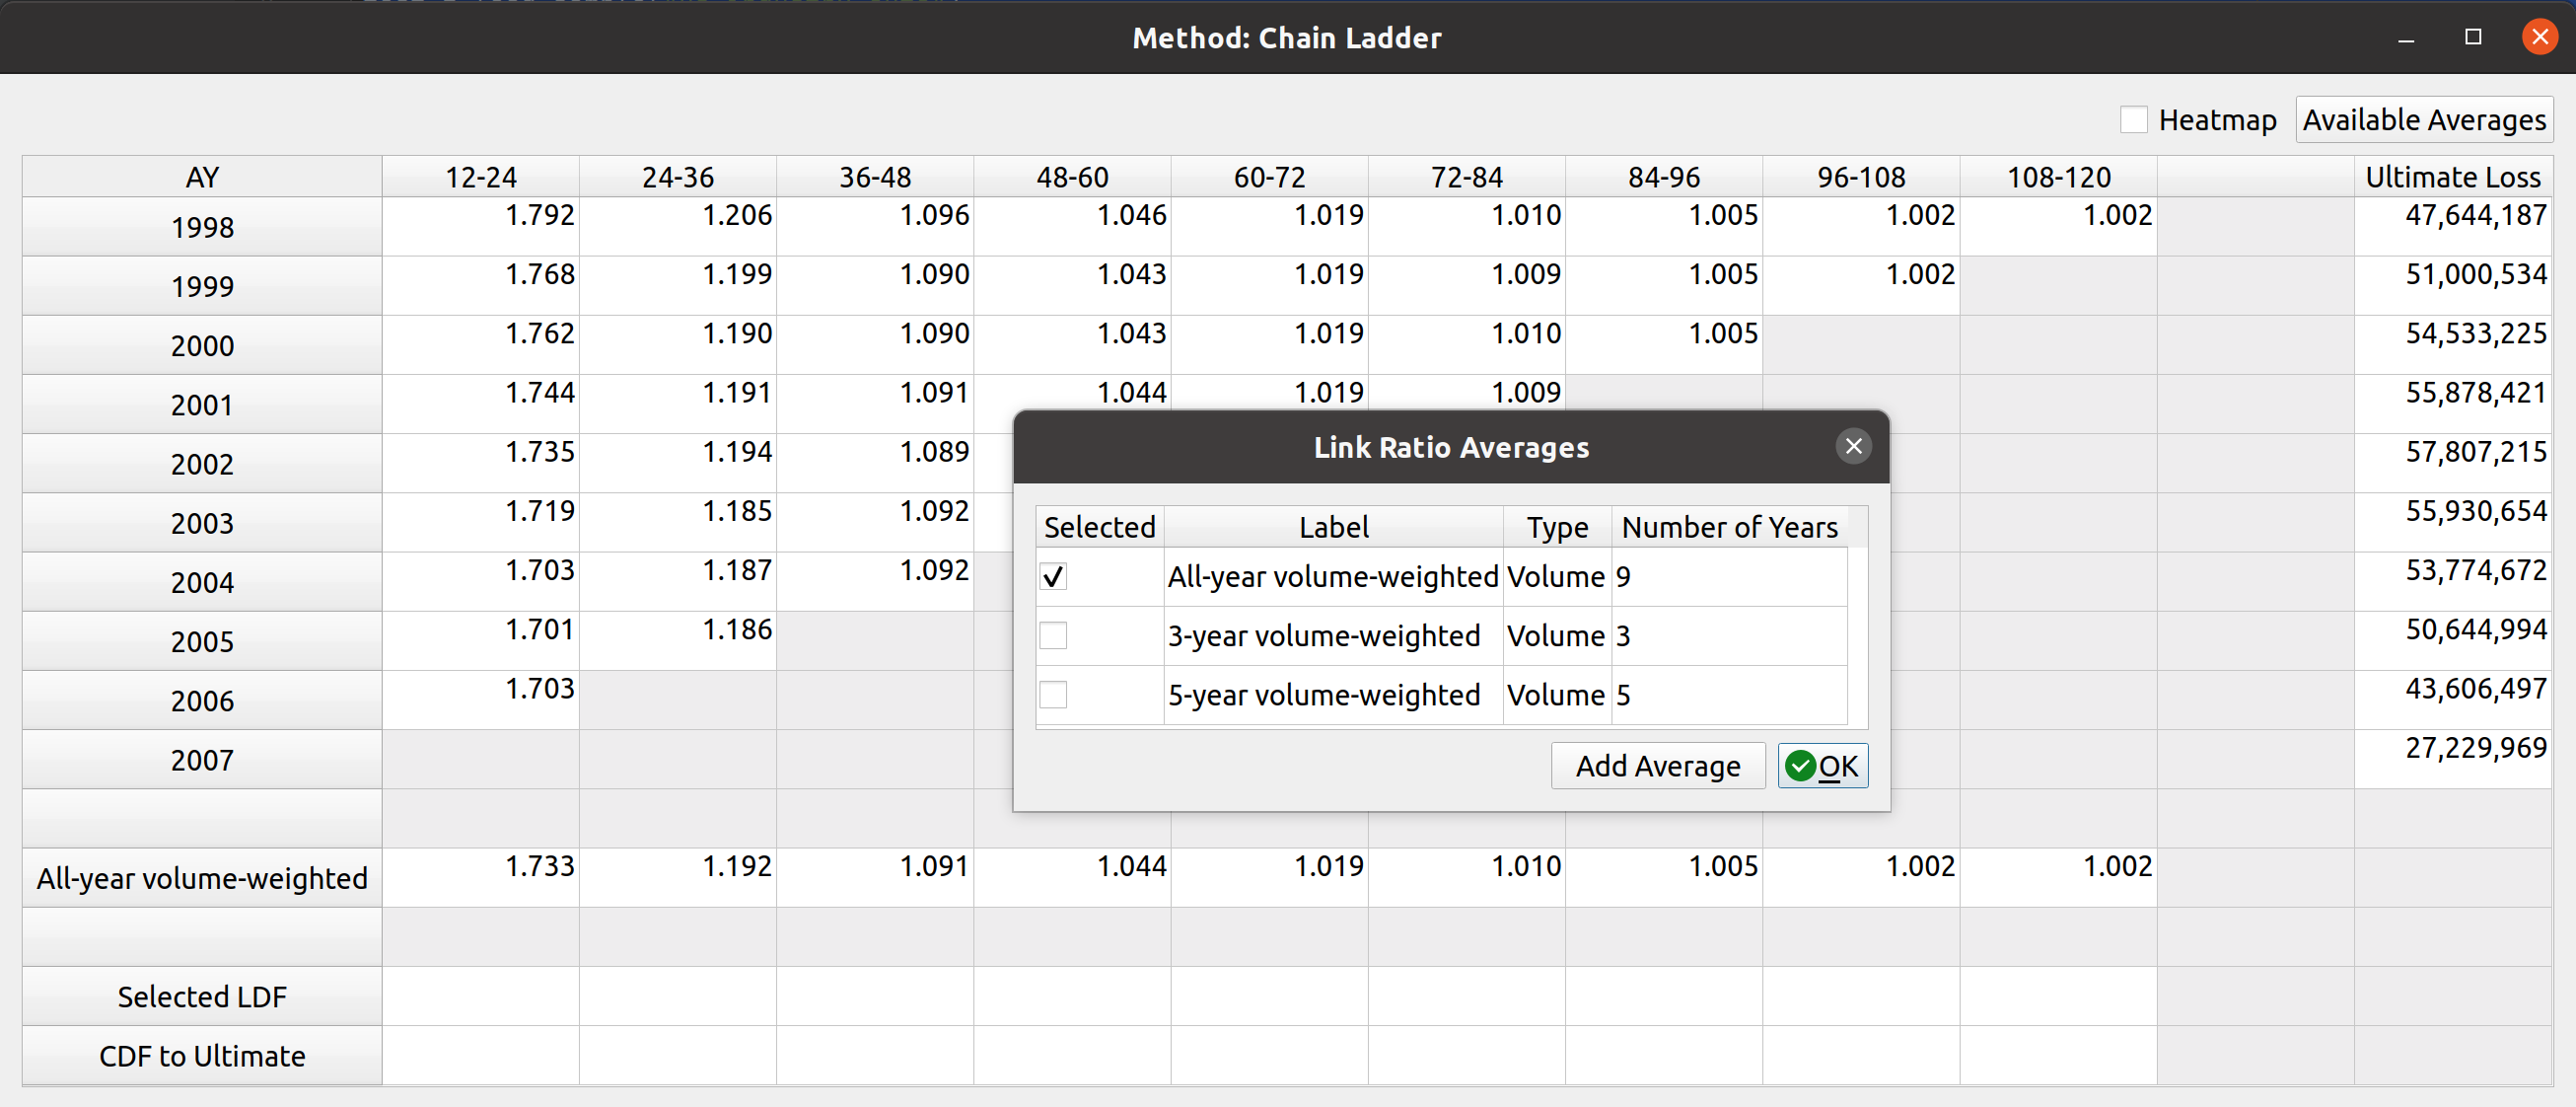
Below the triangle, you will find a section that has various link ratio averages that you can select by double-clicking on them. The image in the previous section only had one option, the all-year volume-weighted average, but you can add more by selecting the “Available Averages” button in the upper-right hand corner. Doing so will open up a dialog box with averages that you can add to the factor view:
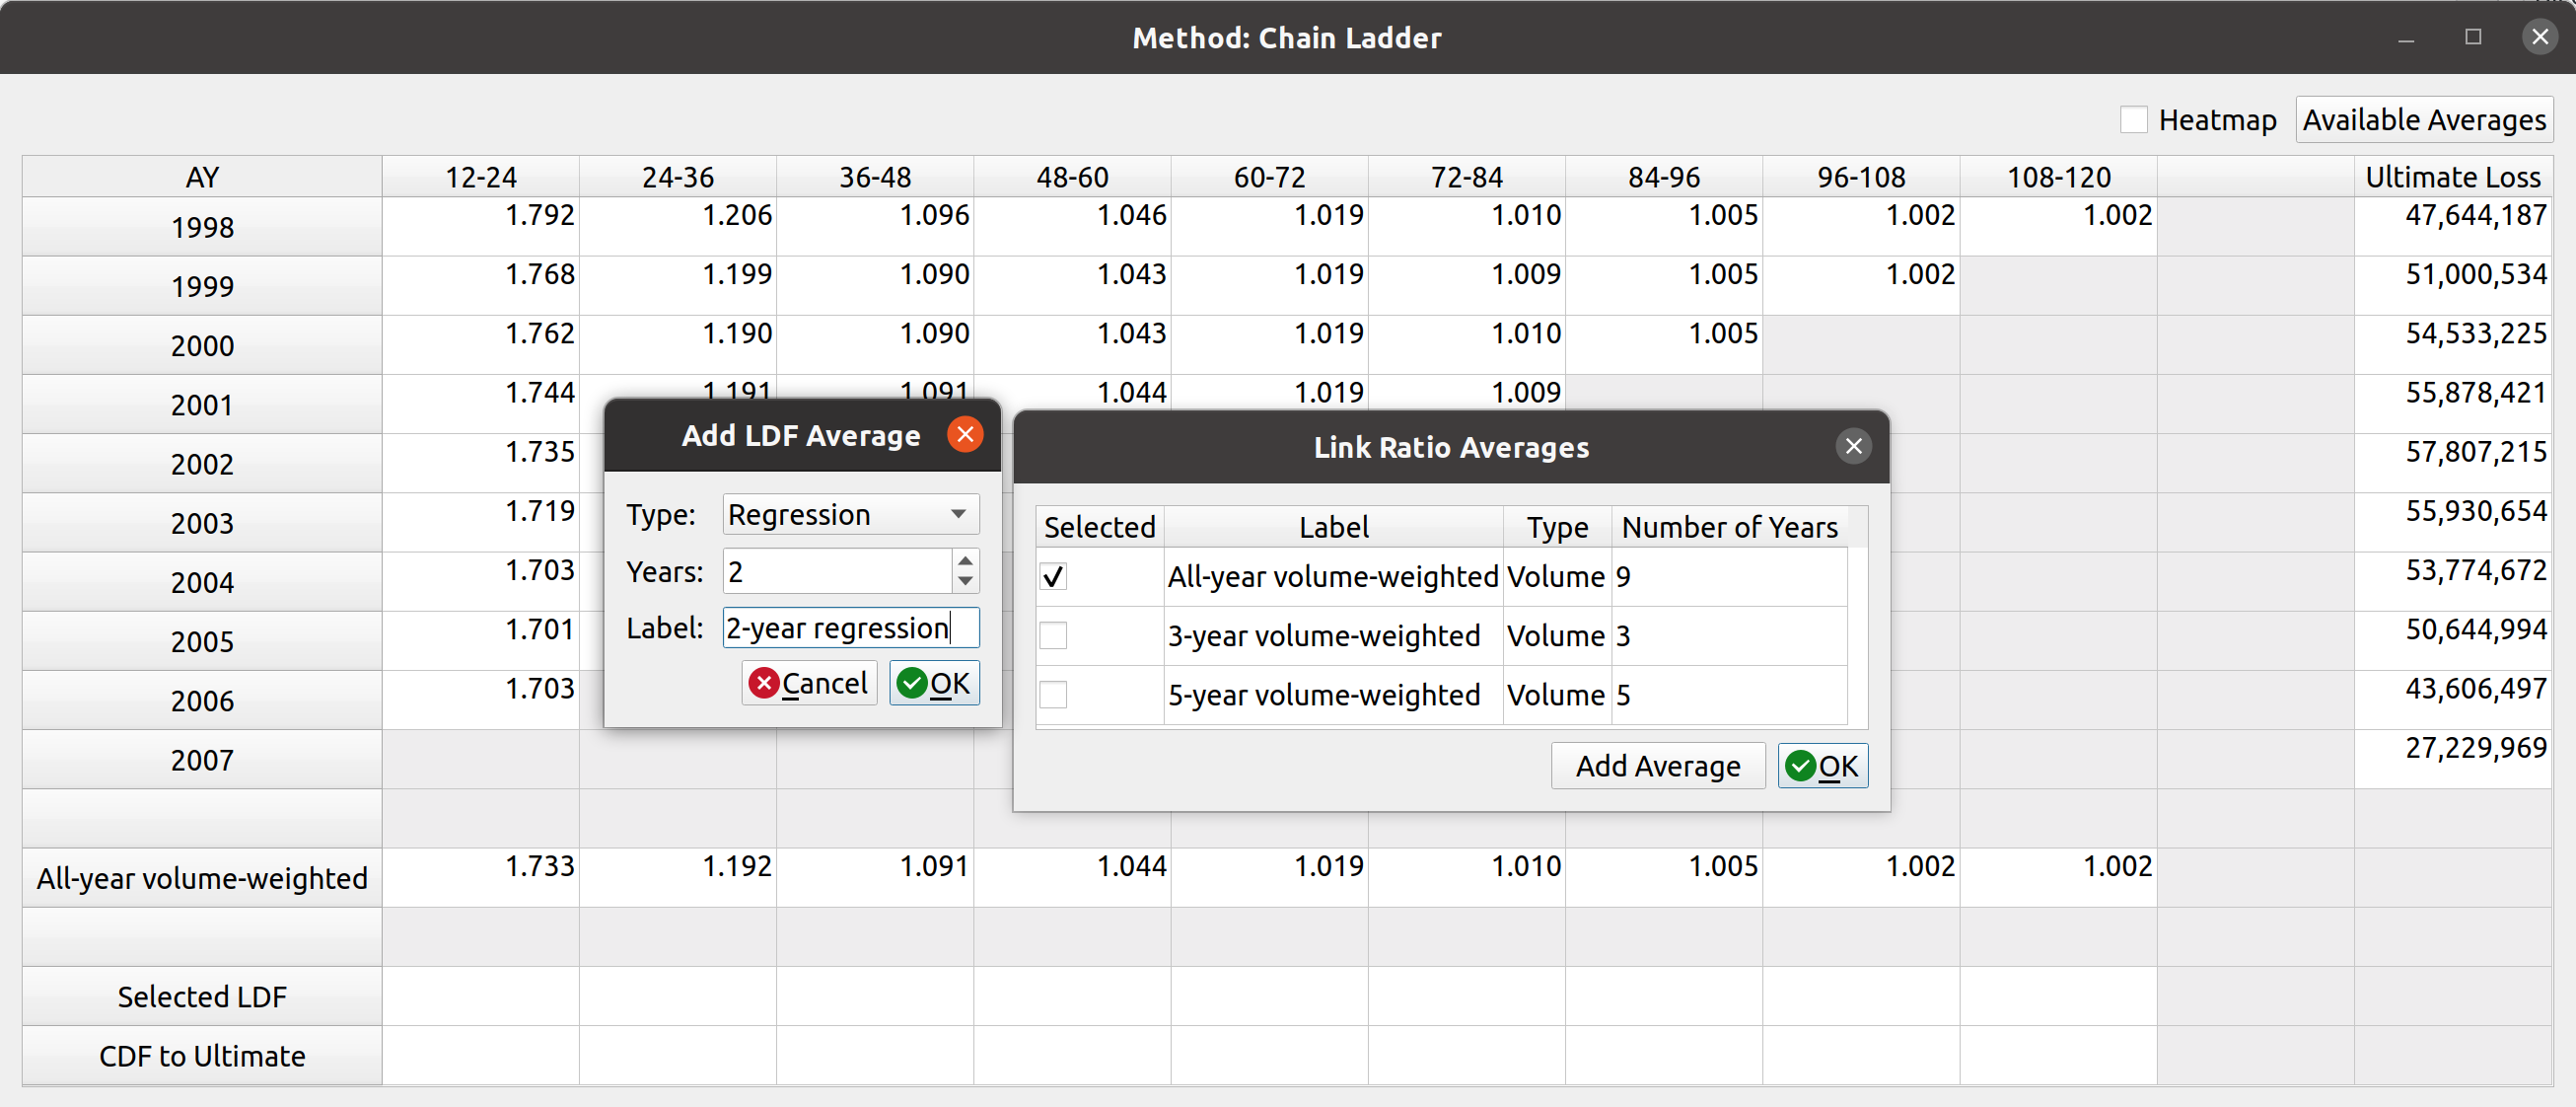
The starting averages are All, 5-, and 3- year volume-weighted averages. You can add these by clicking the checkboxes in the table. Alternatively, you can add a custom type if you want to use a different kind of average like straight or regression. You can do this by clicking the “Add Average” button and then selecting the options for the new average. Right now, only these three are supported by chainladder, but I have proposed that we add others like medial and geometric to the list:
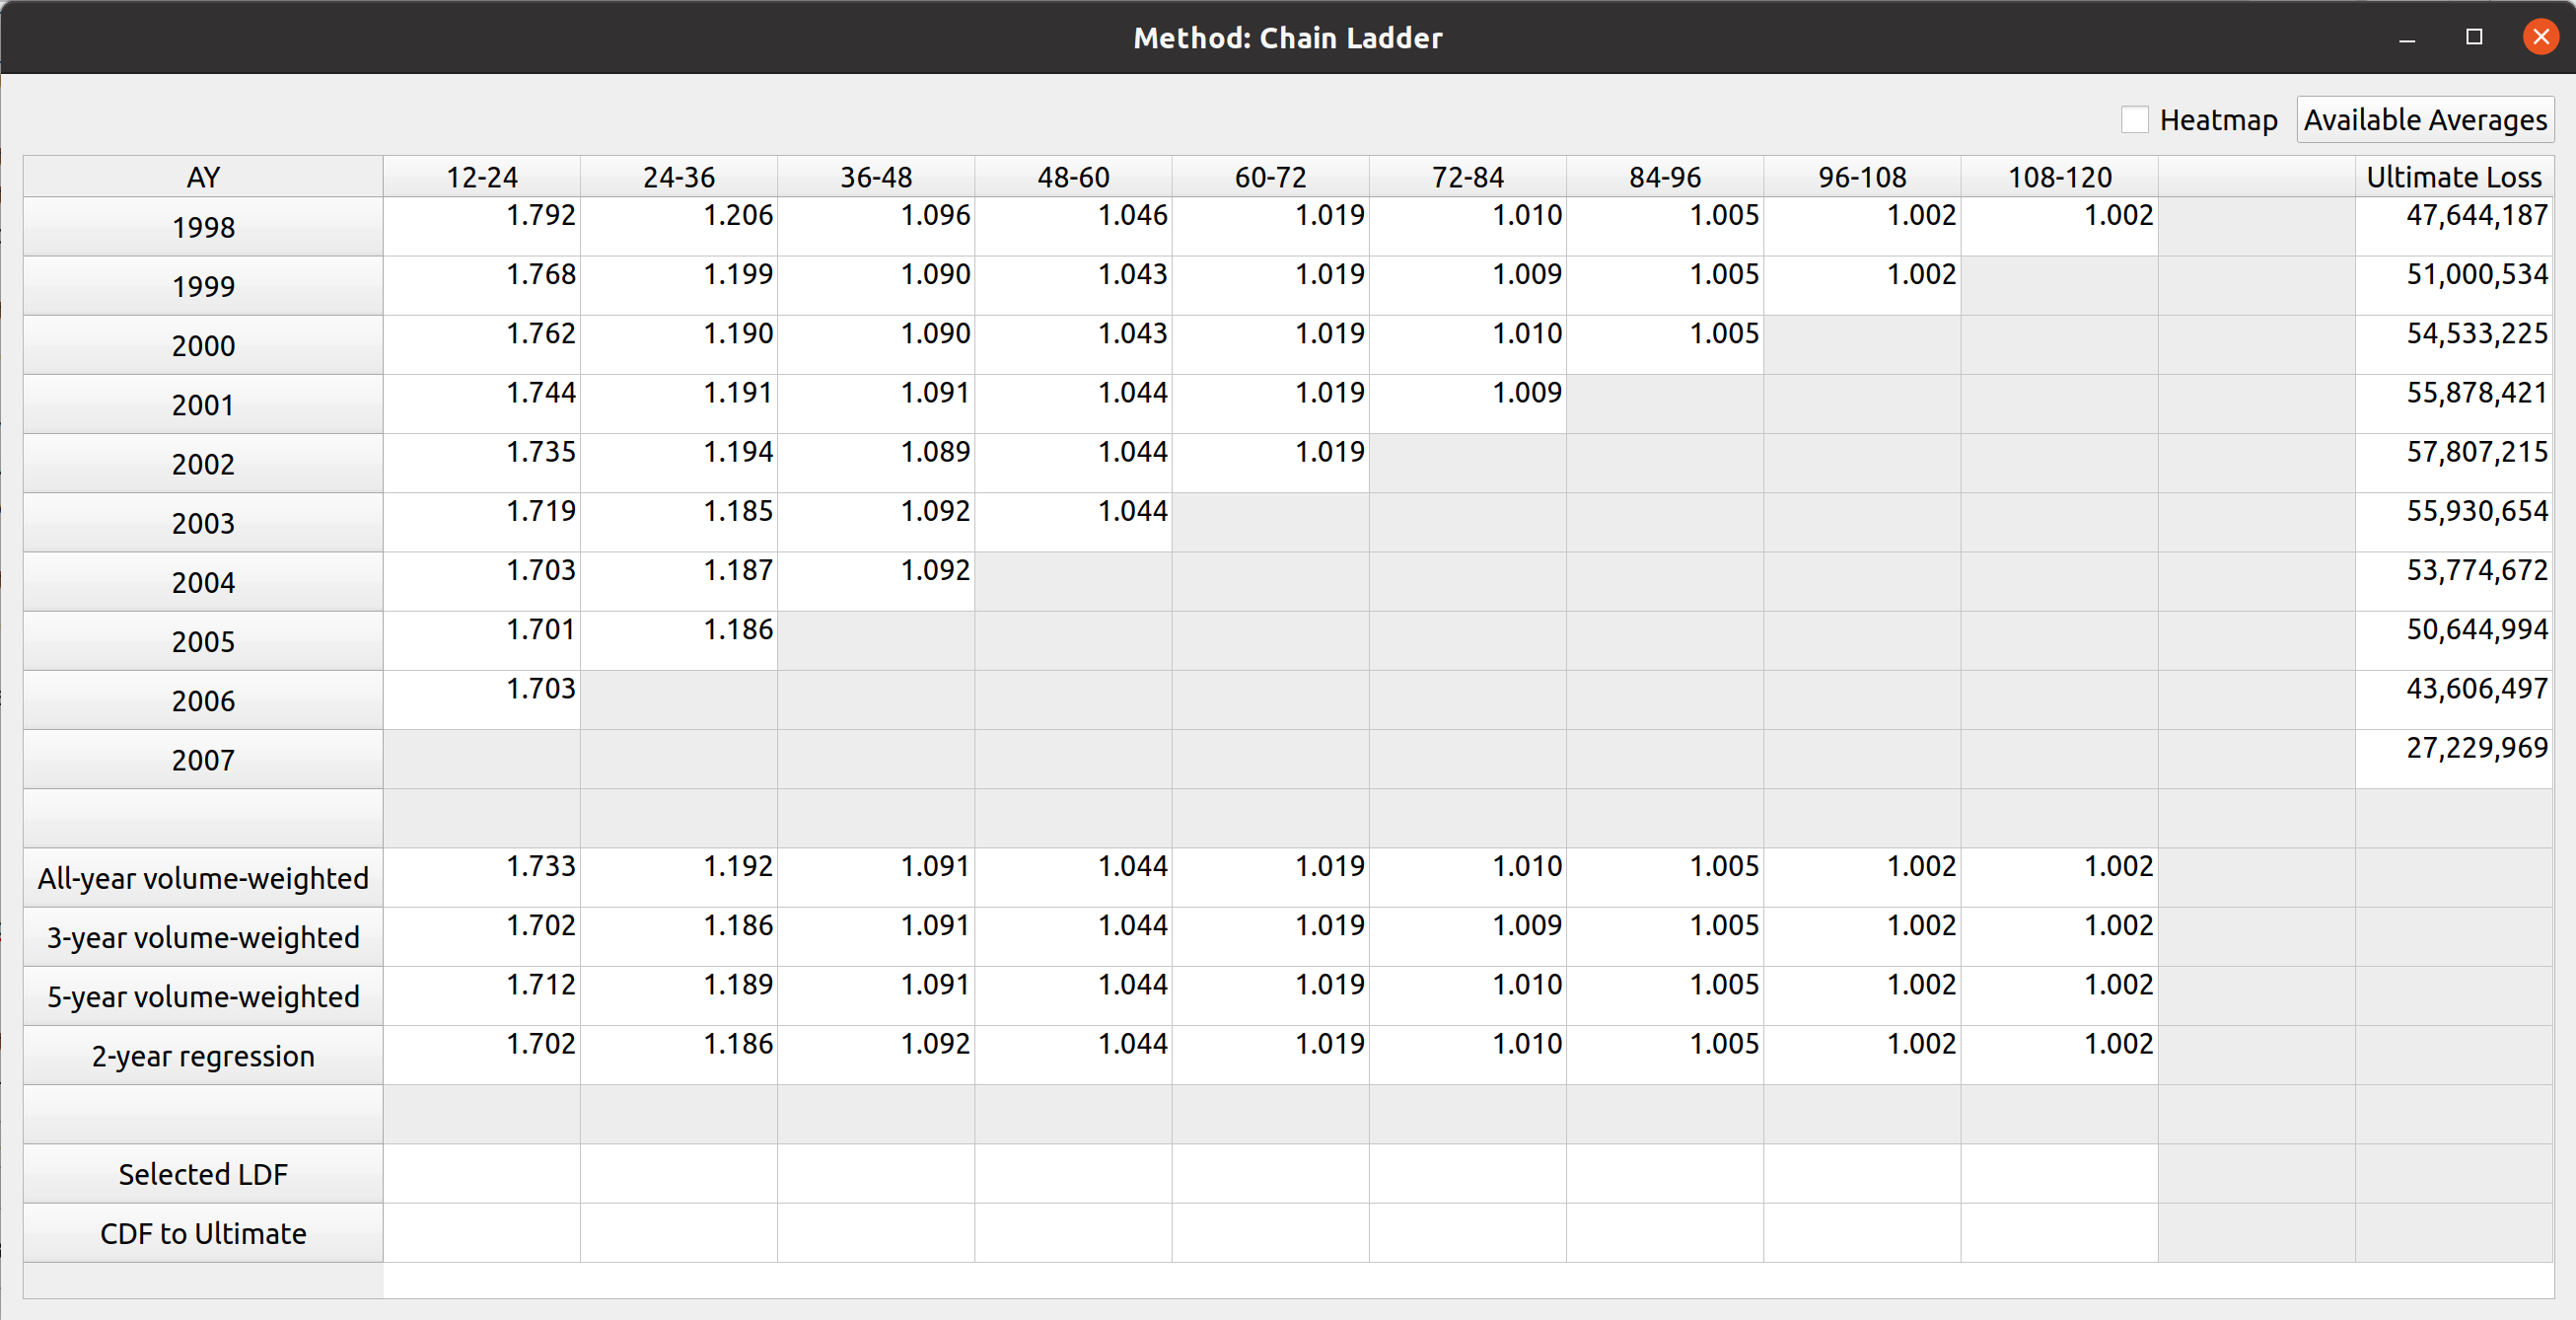
In this example I have added a 2-year regression and selected all 4 average types in the table. This expands the number of rows in the LDF section of the factor view:
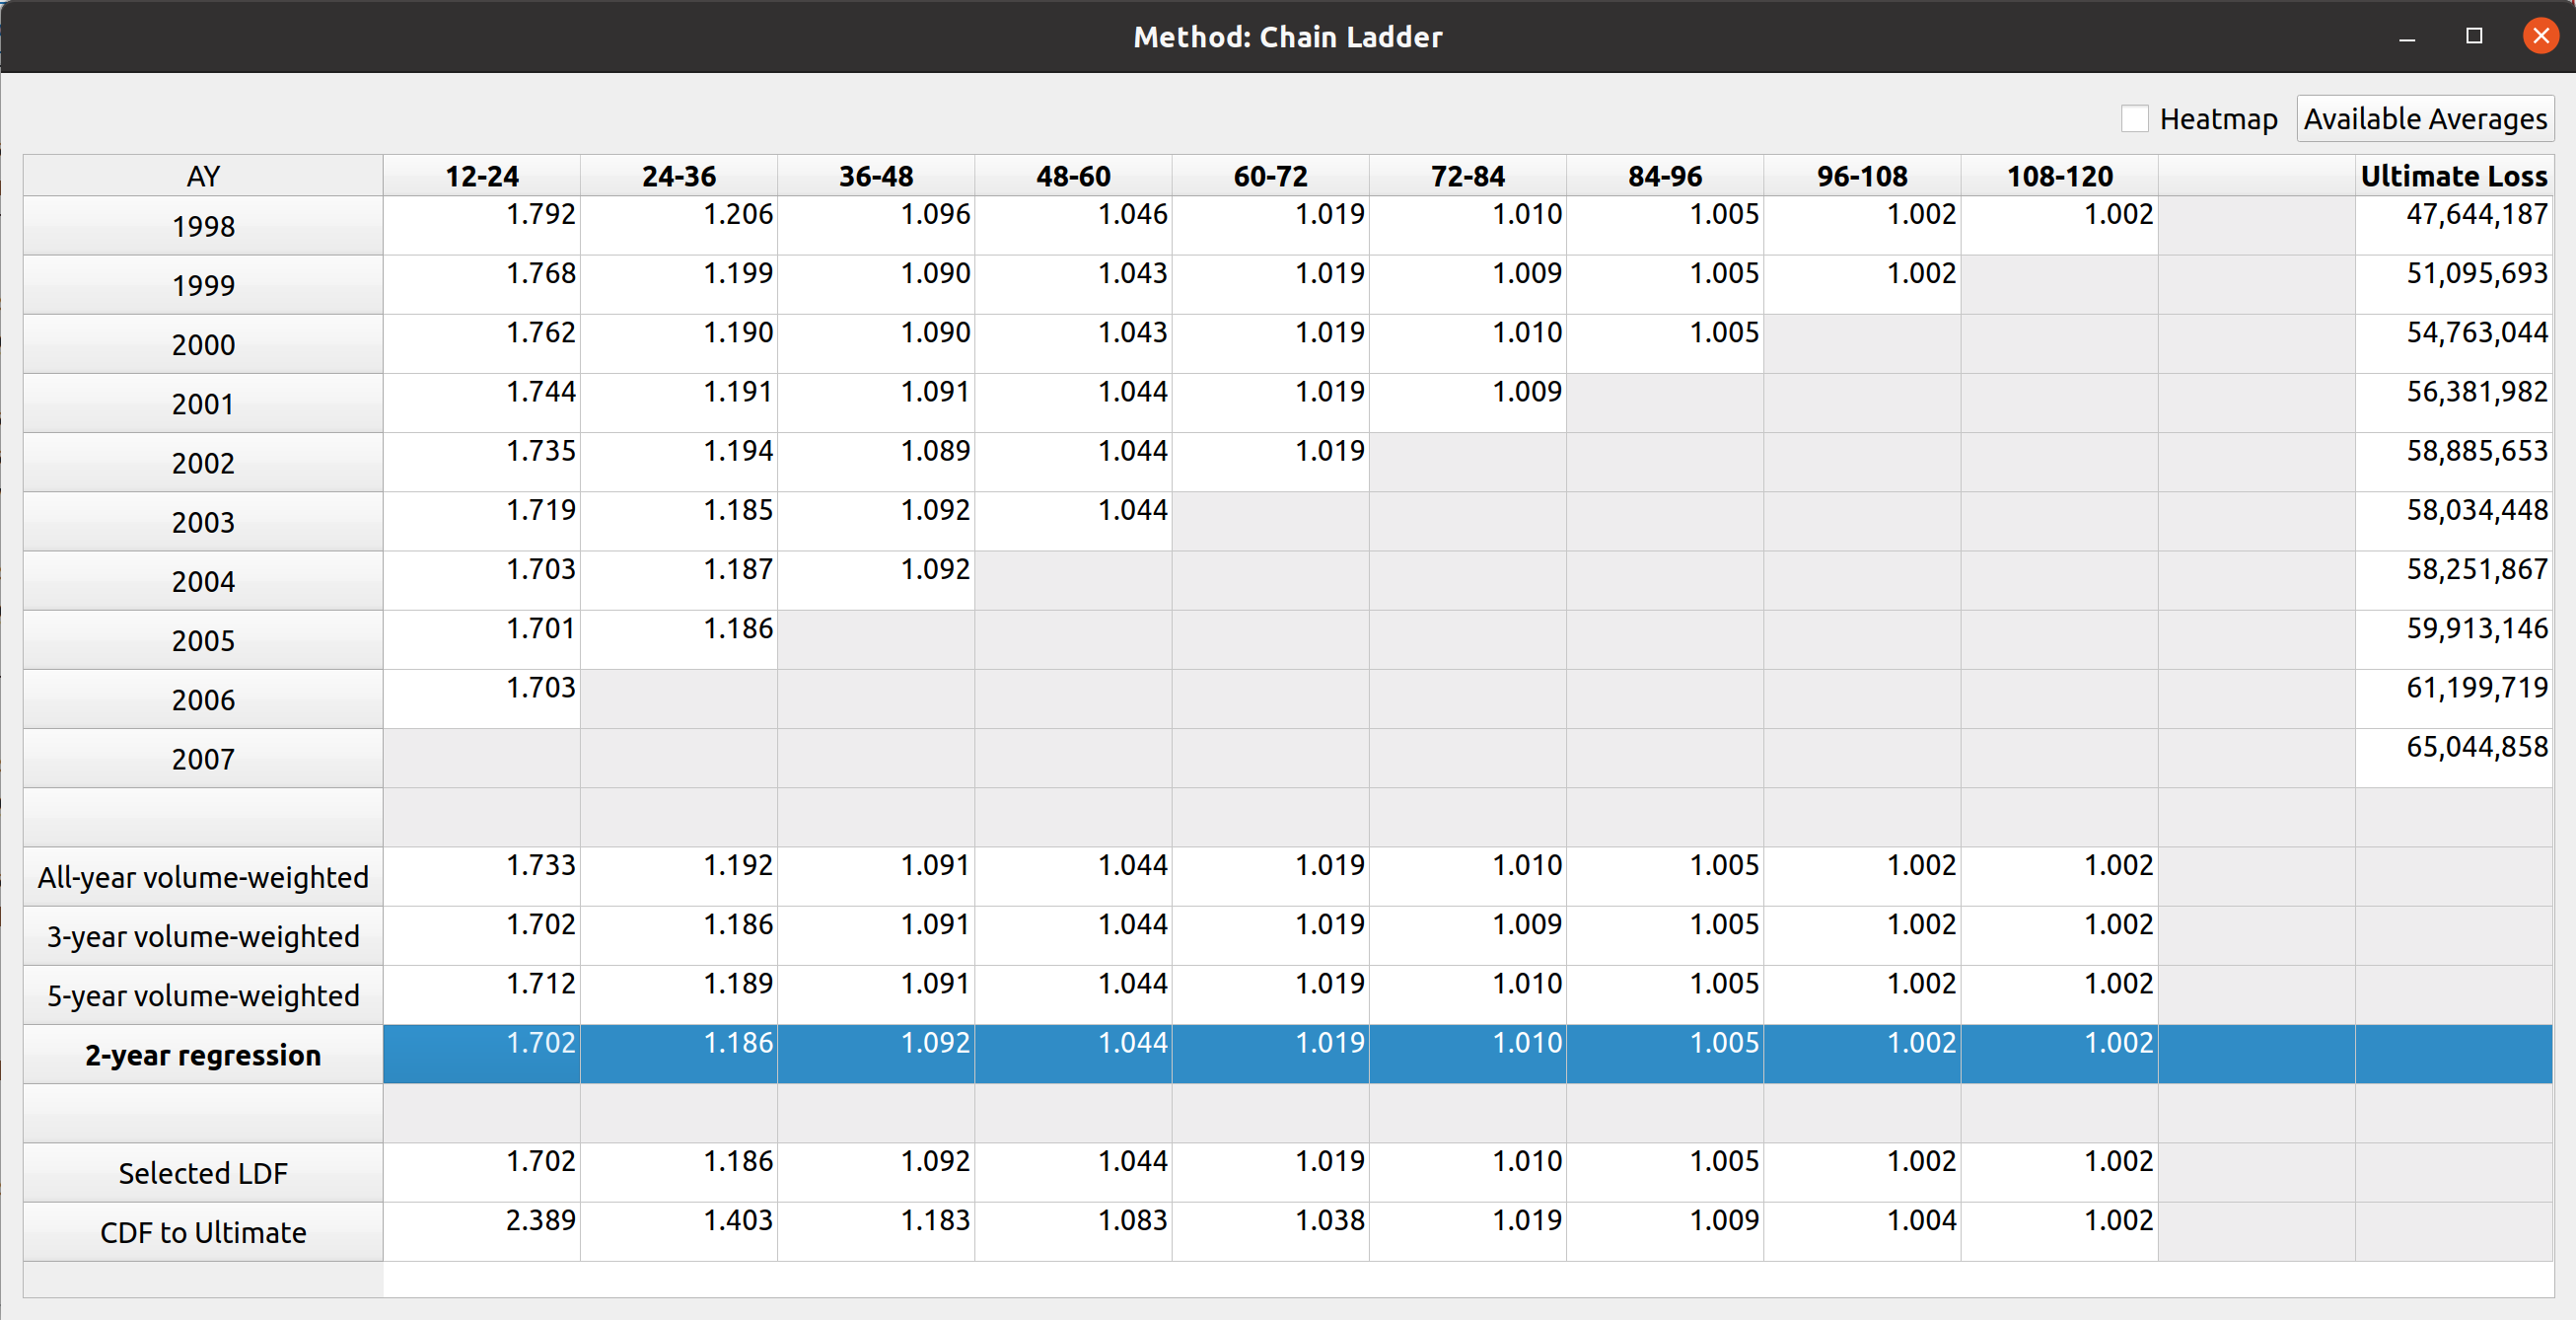
Next, you can select the LDFs by double-clicking on the LDF section. Double-clicking an entire row will select that whole row, and the CDFs are automatically calculated. The image below shows that I have selected the 2-year regression, and the ultimate loss values are automatically updated:
Alternatively, you can enter in your own custom values by typing or copy-pasting into the cells directly. And you can delete the selections by pressing the delete key over the cells or by double-clicking the row header of the selected LDF row. You can also remove LDF average types by clicking on the “available averages” button and unchecking the ones you want to remove.
Heatmap
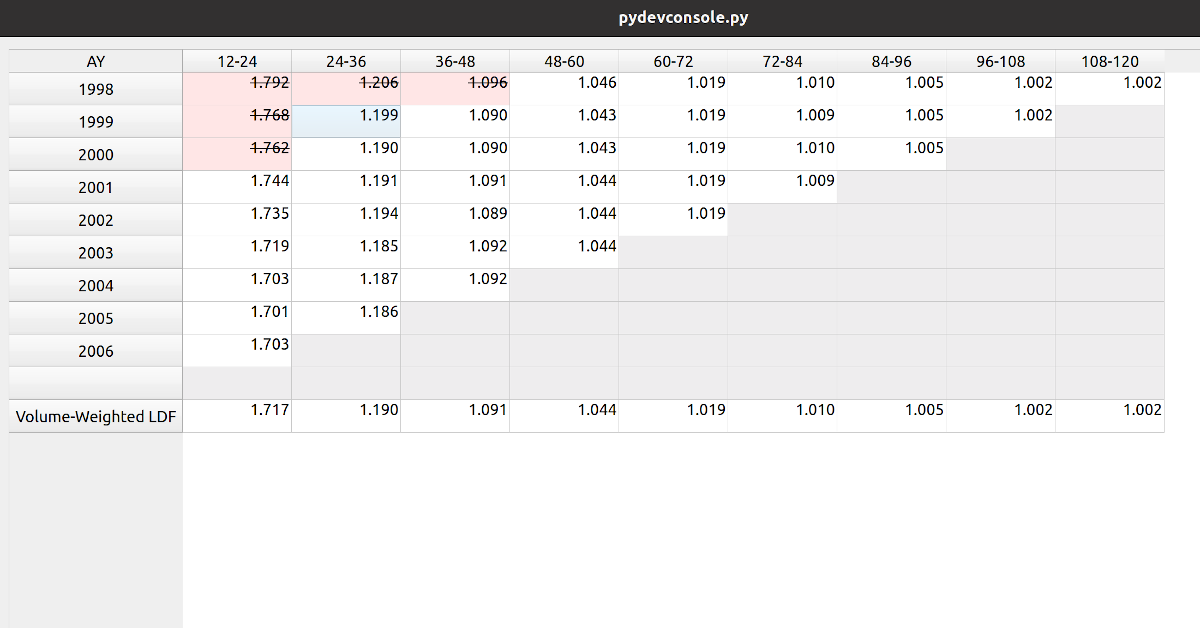
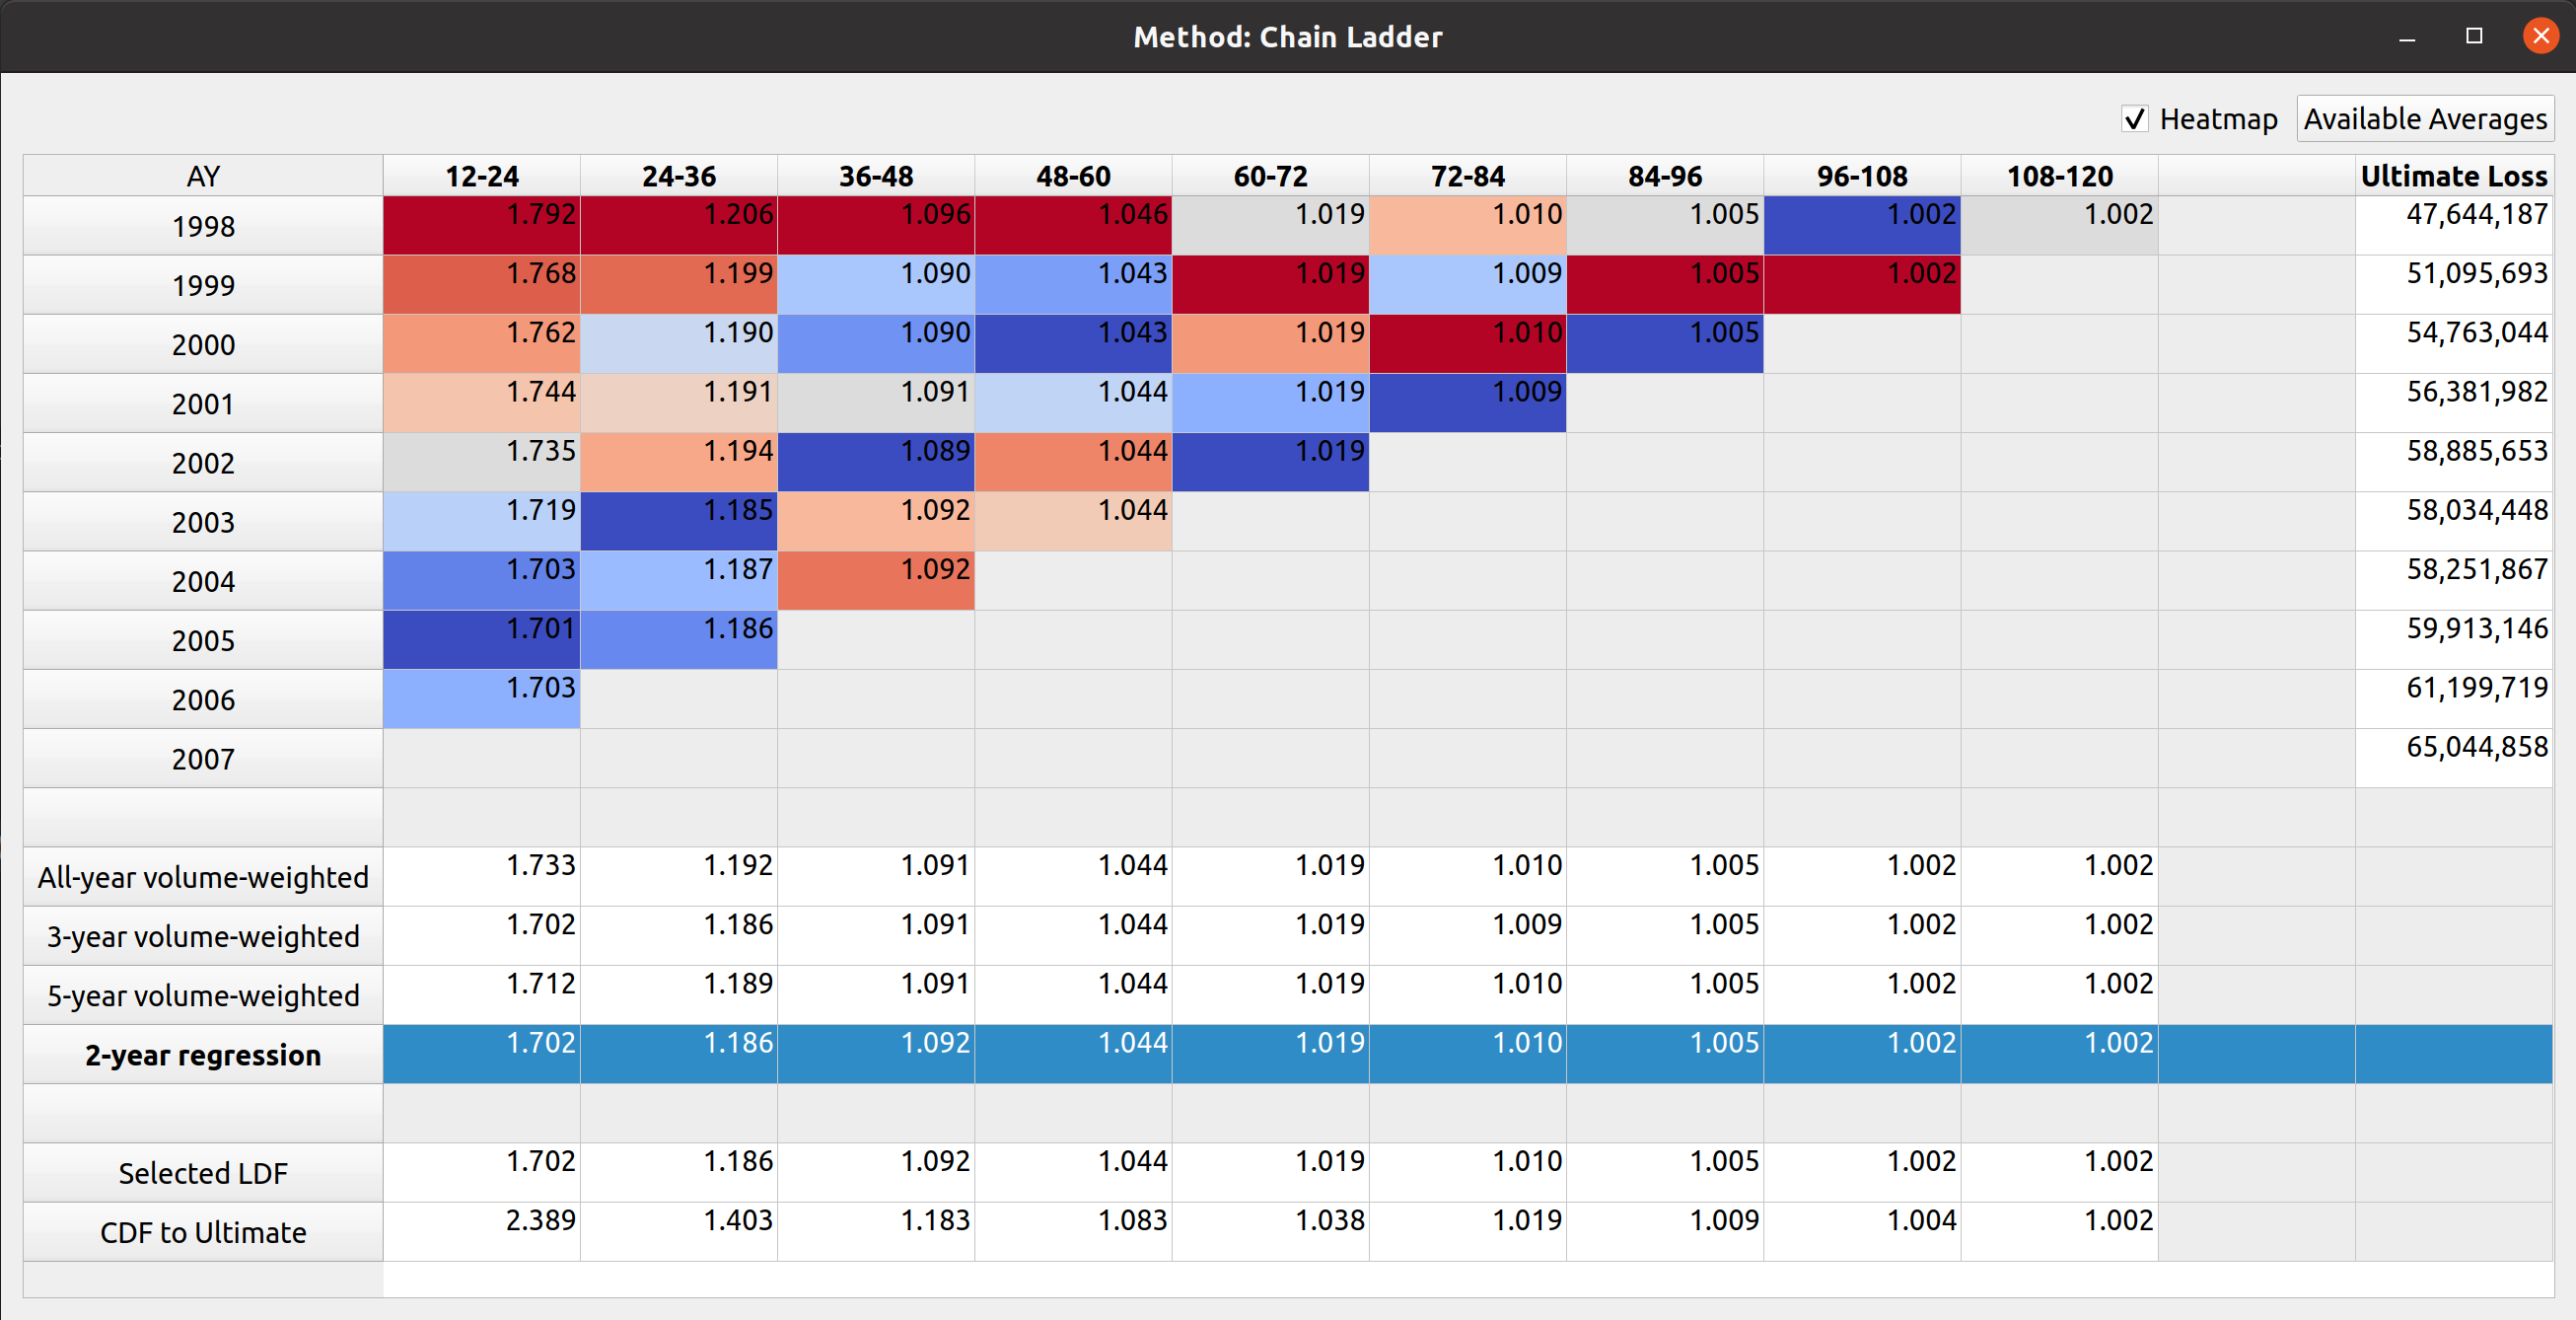
This last feature is something that comes from the chainladder package. It was quite challenging to implement even though on the surface, all you have to do is tick the checkbox. This helps you identify outlier link ratios that you may want to exclude in your analysis:
There are some performance enhancements to be made on this feature, I’ll write up another post once that’s done. Below, you’ll see a gif of all of what I described above in action:
