The release of FASLR v0.0.6 adds an exhibit builder to assist the actuary in comparing output between models and making ultimate selections. Usually, when an actuary conducts a reserve study, they will employ a variety of models using different actuarial methods to estimate the ultimate value of losses. The reason why this is done is because no single model is a perfect representation of reality – each method comes with its own strengths and weaknesses. By offering a way for the user to develop custom exhibits to make comparisons between those models, FASLR (Free Actuarial System for Loss Reserving) enables the actuary to balance these trade-offs to select what they believe to be their best estimate of ultimate losses.
Furthermore, I wanted to make sure the user had the ability to fully customize their reports. Otherwise, static reports would limit the capabilities of FASLR and give users the urge to export things to Excel to make up for its shortcomings – something all too common with financial software. By enabling customization, I hope to not only drive long-term user engagement, but also to make the reserving experience as pleasant as possible.
Although this feature may appear to be mundane compared to those involving sophisticated actuarial methods, it is nonetheless an essential part of FASLR and was the most difficult thing to design so far in the lifespan of the project. The reason why is because Qt did not provide a native way to display hierarchical headers, which are commonly found in Excel-based financial reports. In researching how to implement this via subclassing, I came across a post on stack overflow where another user achieved this using C++, for which I am grateful. I was able to port his solution over to Python, but understanding what he did and then translating the language took about three weeks to do. Furthermore, many of the column manipulation features I wanted to add were difficult to pull off – with still more bugs for me to handle in the near future.
Thankfully, I was able to get a prototype running that demonstrates most of what I wanted to achieve, showing that FASLR can one day do important things, provided I have the time to polish it up. Today, I will demonstrate how it works by replicating a result from the Friedland reserving paper.
As usual, feel free to browse the documentation or the source code hosted on the CAS GitHub page.
Basic Layout
The exhibit builder has three main components:
- Model Columns
- Exhibit Columns
- Exhibit Preview
The Model Columns are located as a tab widget in the upper left-hand corner. Here we have two models, each of which has a variety of components available, such as year, age, CDFs, losses, etc., that can be included in a report.
The Exhibit Columns is the list box in the upper-right hand corner. These are the columns selected from the model that will be displayed in the exhibit.
The Exhibit Preview is the table at the bottom. This displays the columns listed in the Exhibit Columns box in the form of a table, to let the user preview what their report will look like.
Example Demonstration
Consider the following exhibit from the Friedland text. Here, we are trying to project ultimate claims, and we have constructed two models using the chain ladder method – one using paid claims, and the other using reported claims.
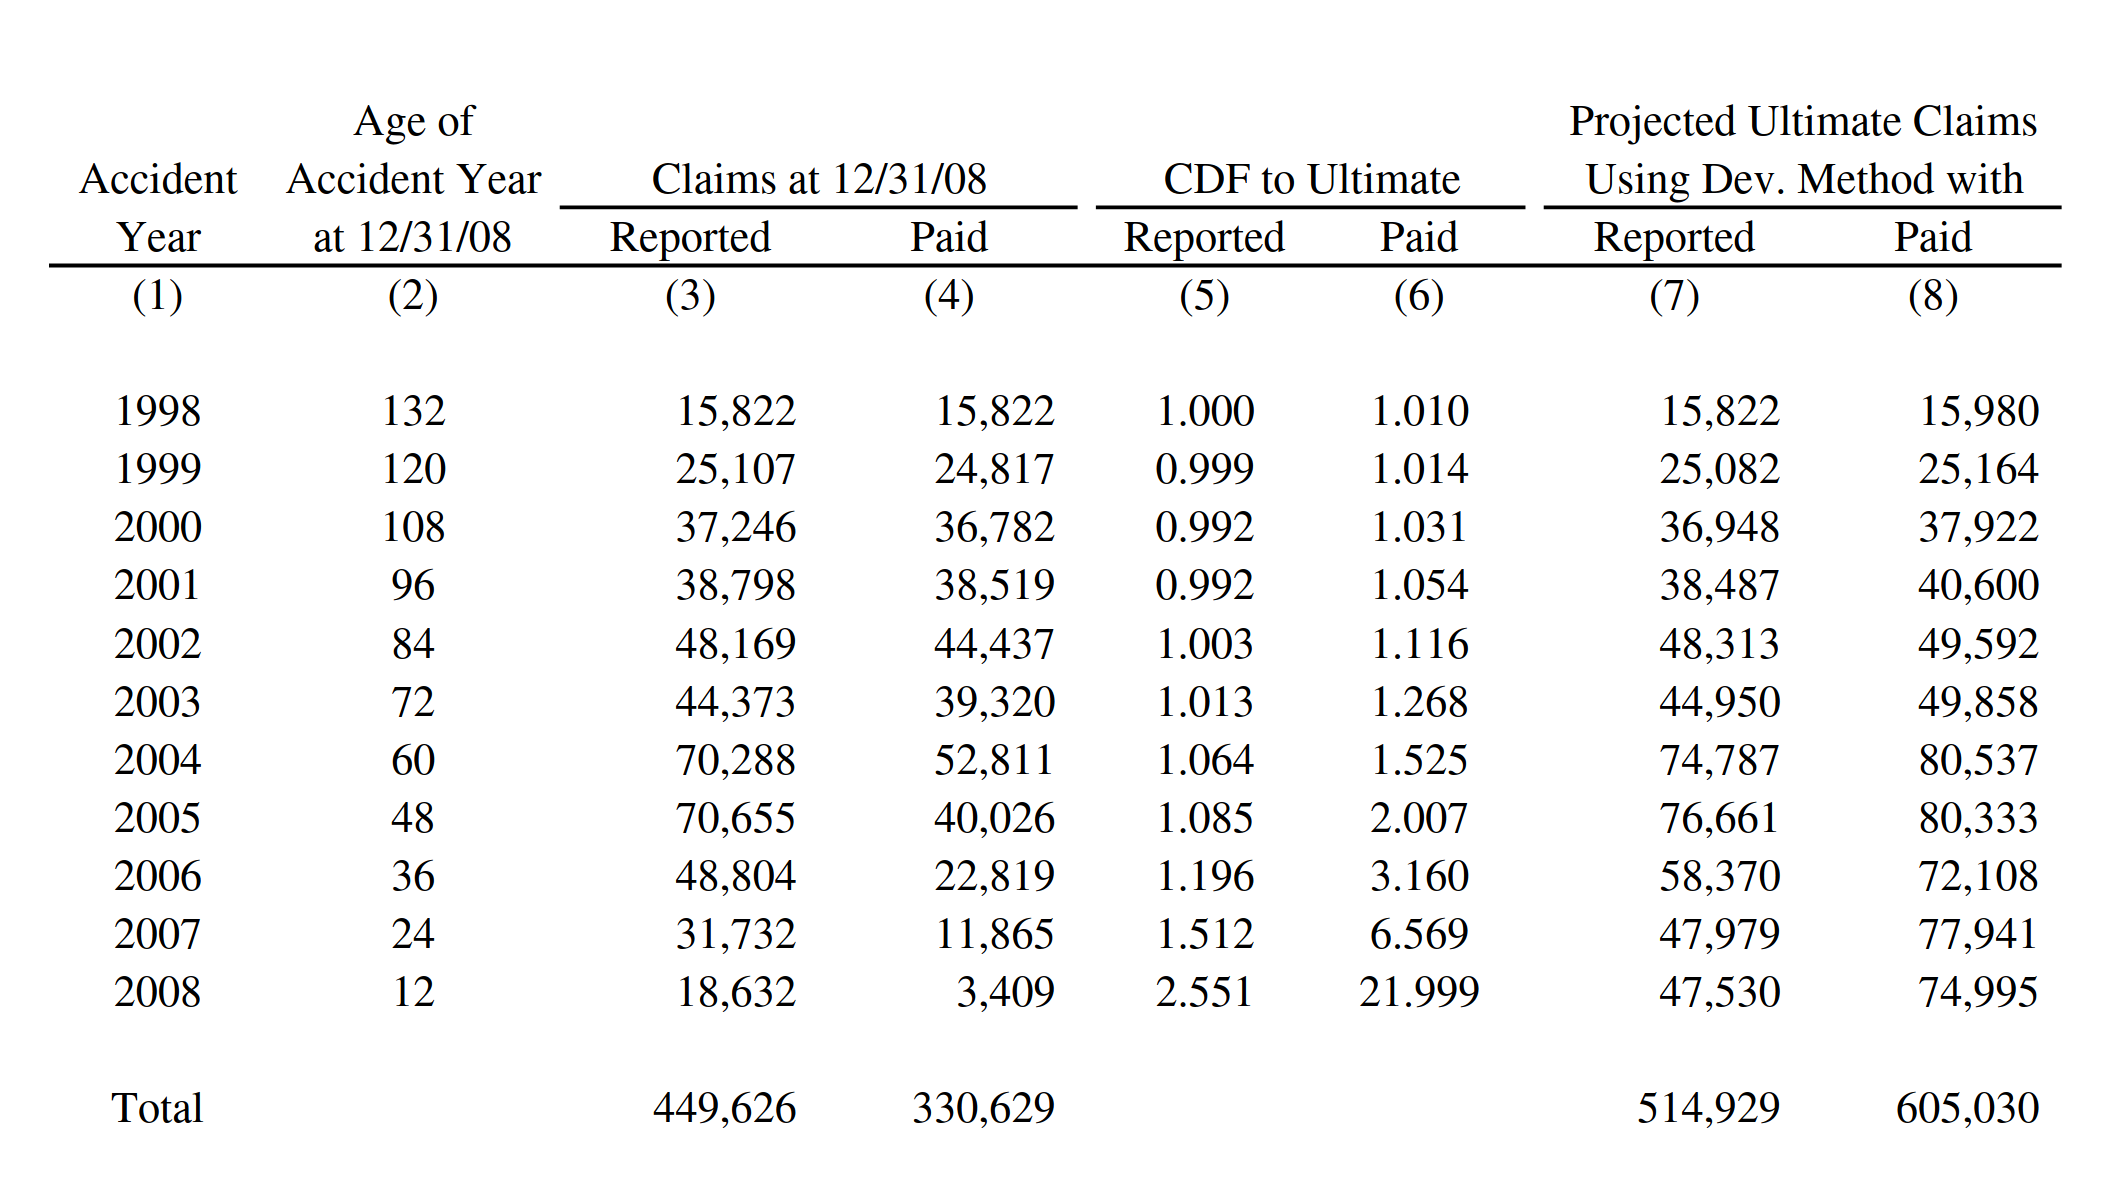
Now, I will demonstrate how we can replicate this exhibit in FASLR. My values won’t match exactly. There are some tail factors from the text that I am not including here, and some rounding errors will produce slightly different numbers anyway. My main focus is just getting the overall layout of the report right.
The big challenge, as mentioned before, was making the hierarchical headers. For example, in the image above, columns (3) and (4) have two levels of headers – the topmost header “Claims at 12/31/08” groups two headers below it, “Reported,” and “Paid.” Data formatted for human reading are often structured differently than those used for mathematical analysis, and the use of features such as hierarchical headers makes things easier to understand for the person. One of FASLR’s features for exhibits enables the user to group columns together in this fashion.
Column Selection
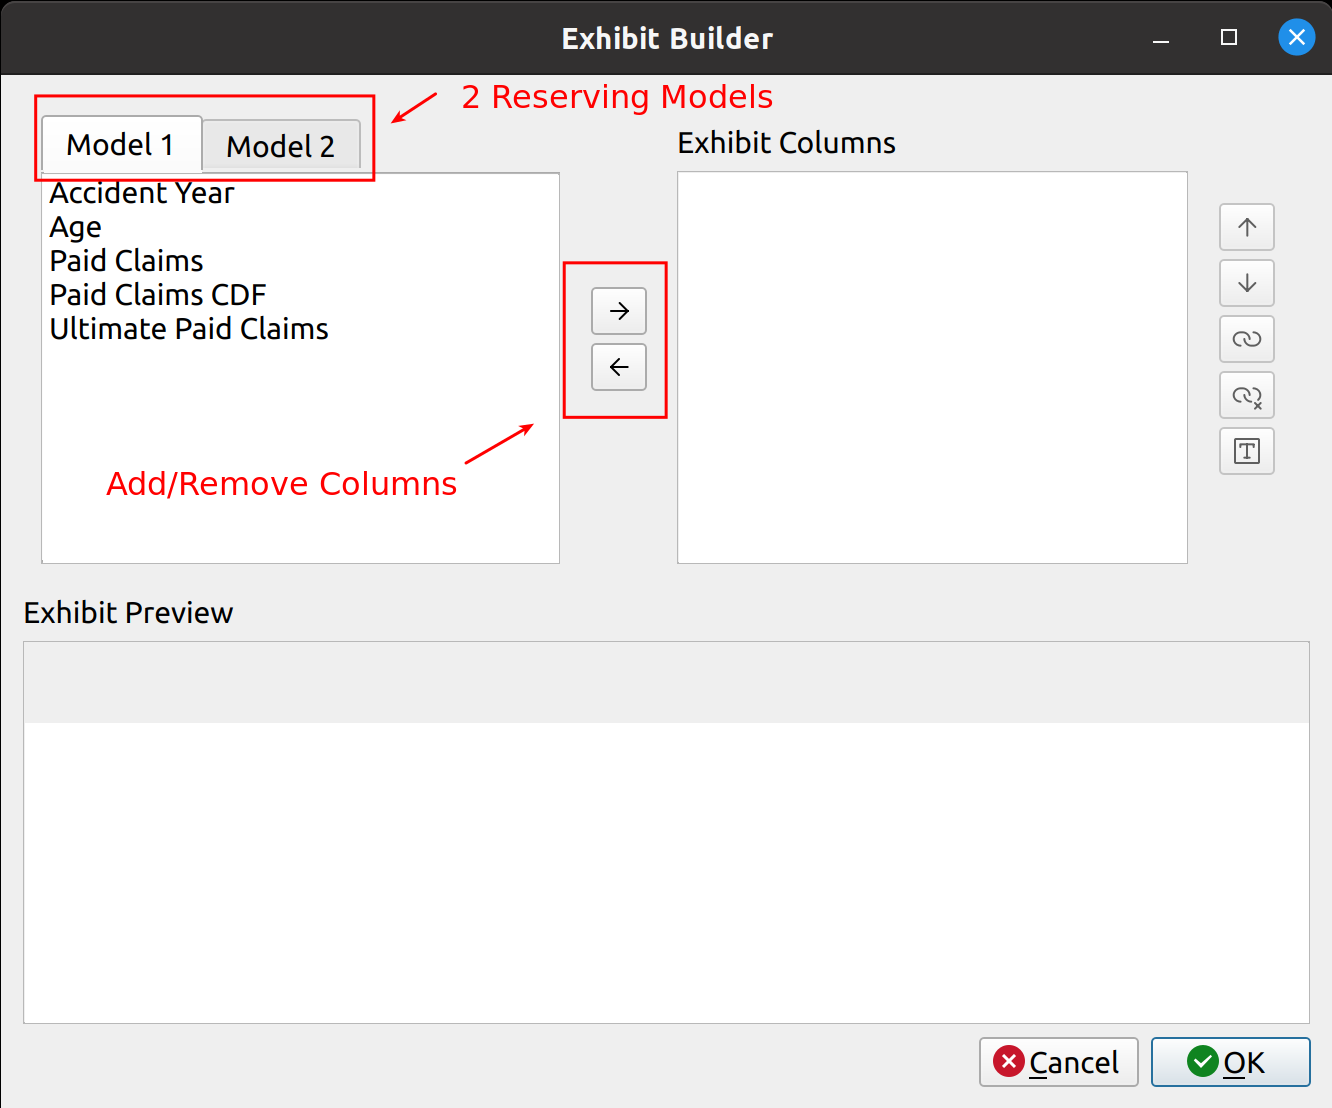
First, we start with a blank Exhibit Builder. The two tabs, labeled Model 1 and Model 2, contain the available components from two fitted models, a paid chain ladder model and a reported chain ladder model, respectively. In the middle, we may use the arrow buttons to add or remove columns from the exhibit. To do this, we click on the columns we want from the tabs and then click the right arrow button:
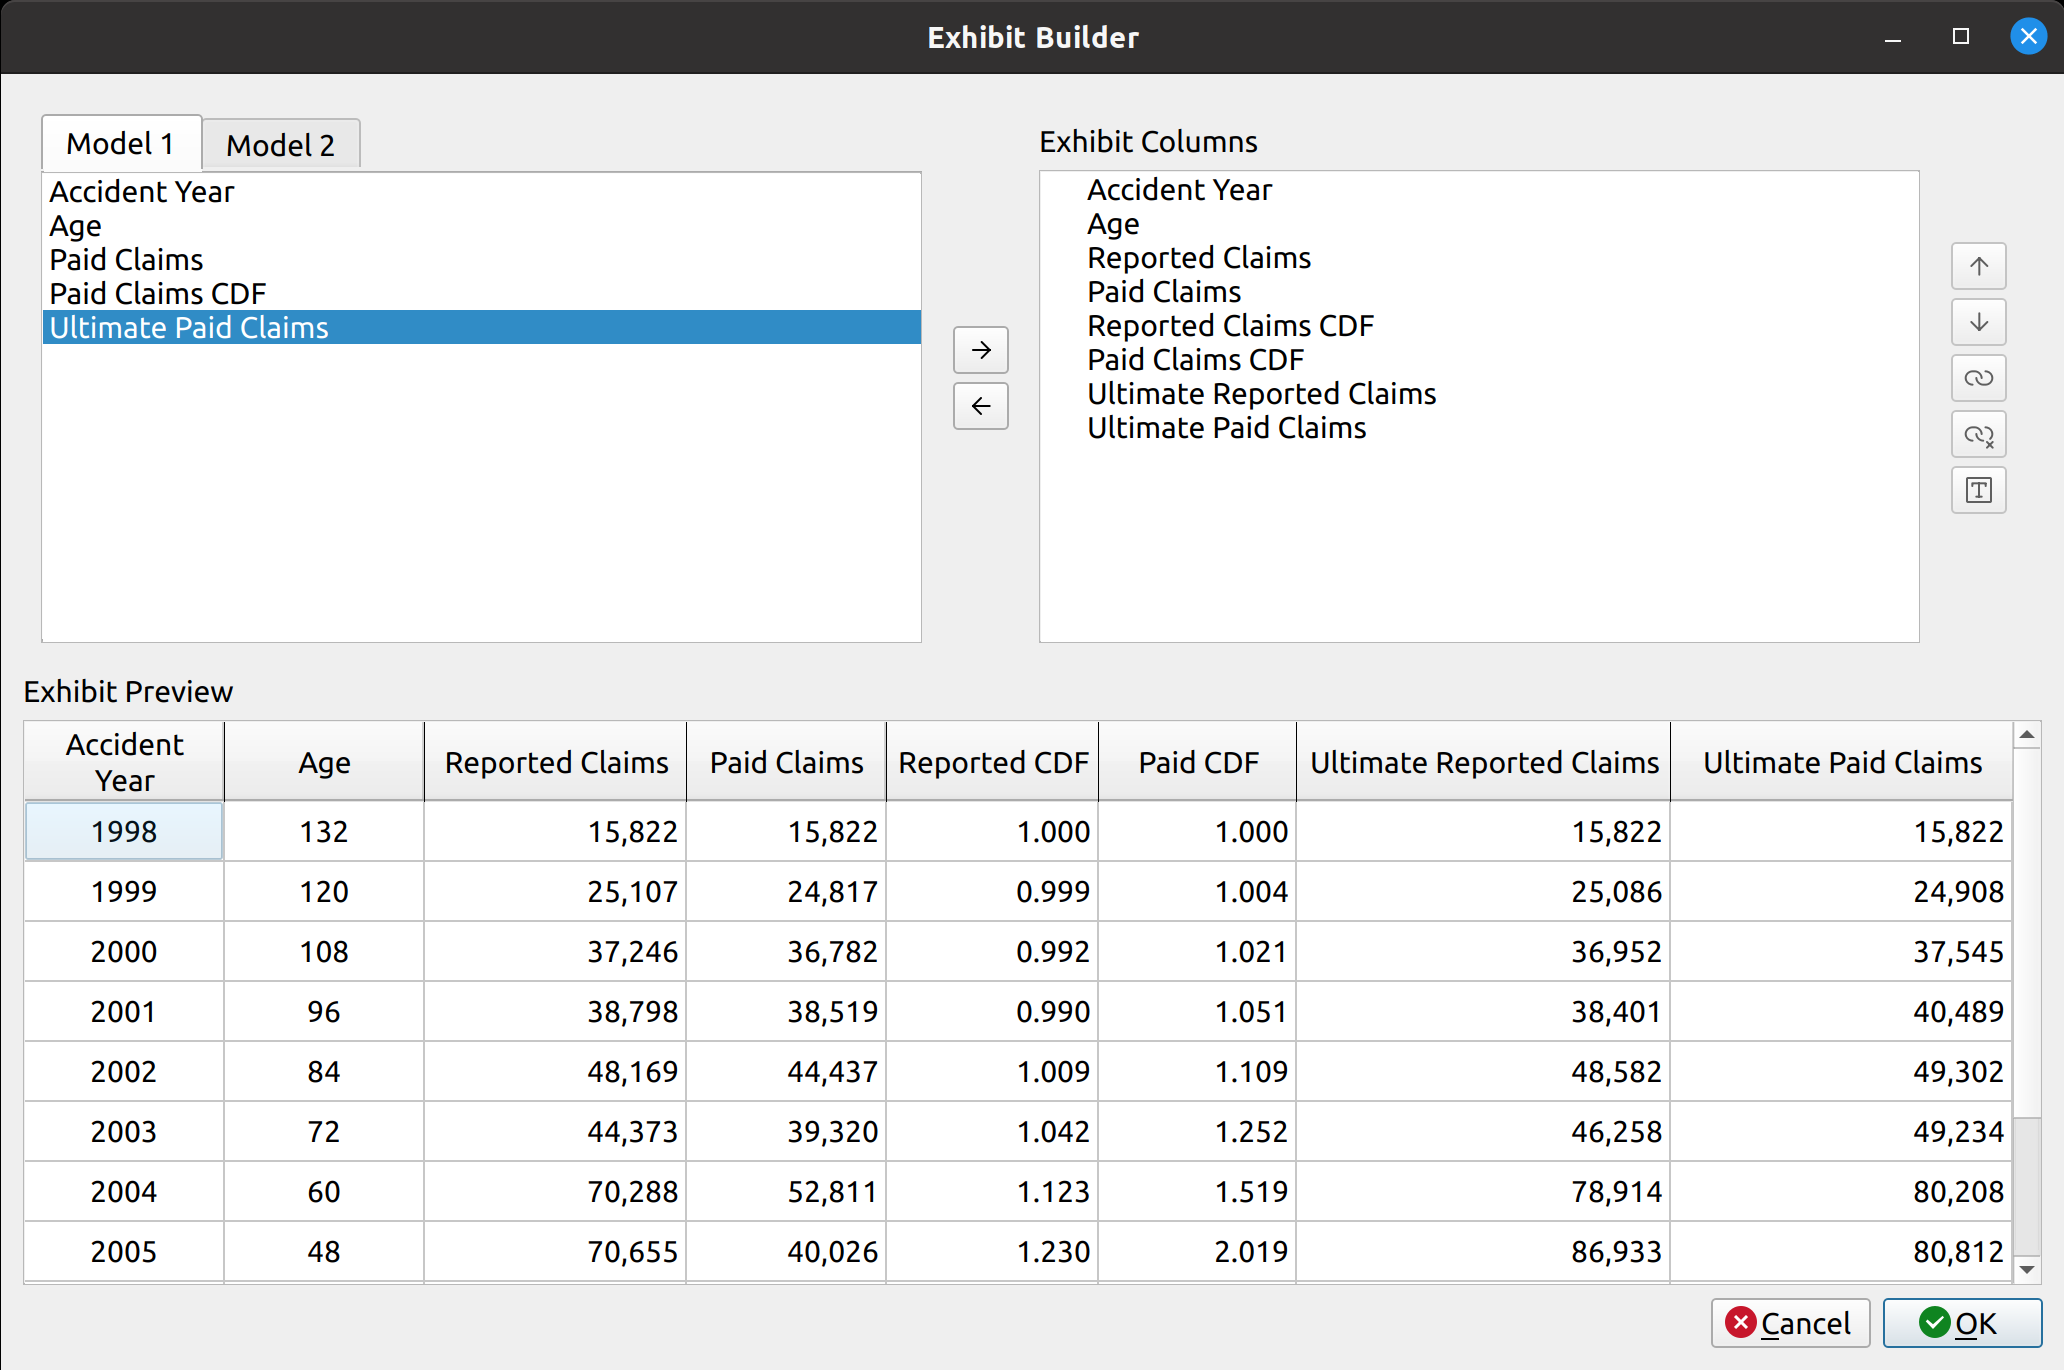
You can now see that the Exhibit Preview gets populated with data from these selected columns.
Grouping Columns
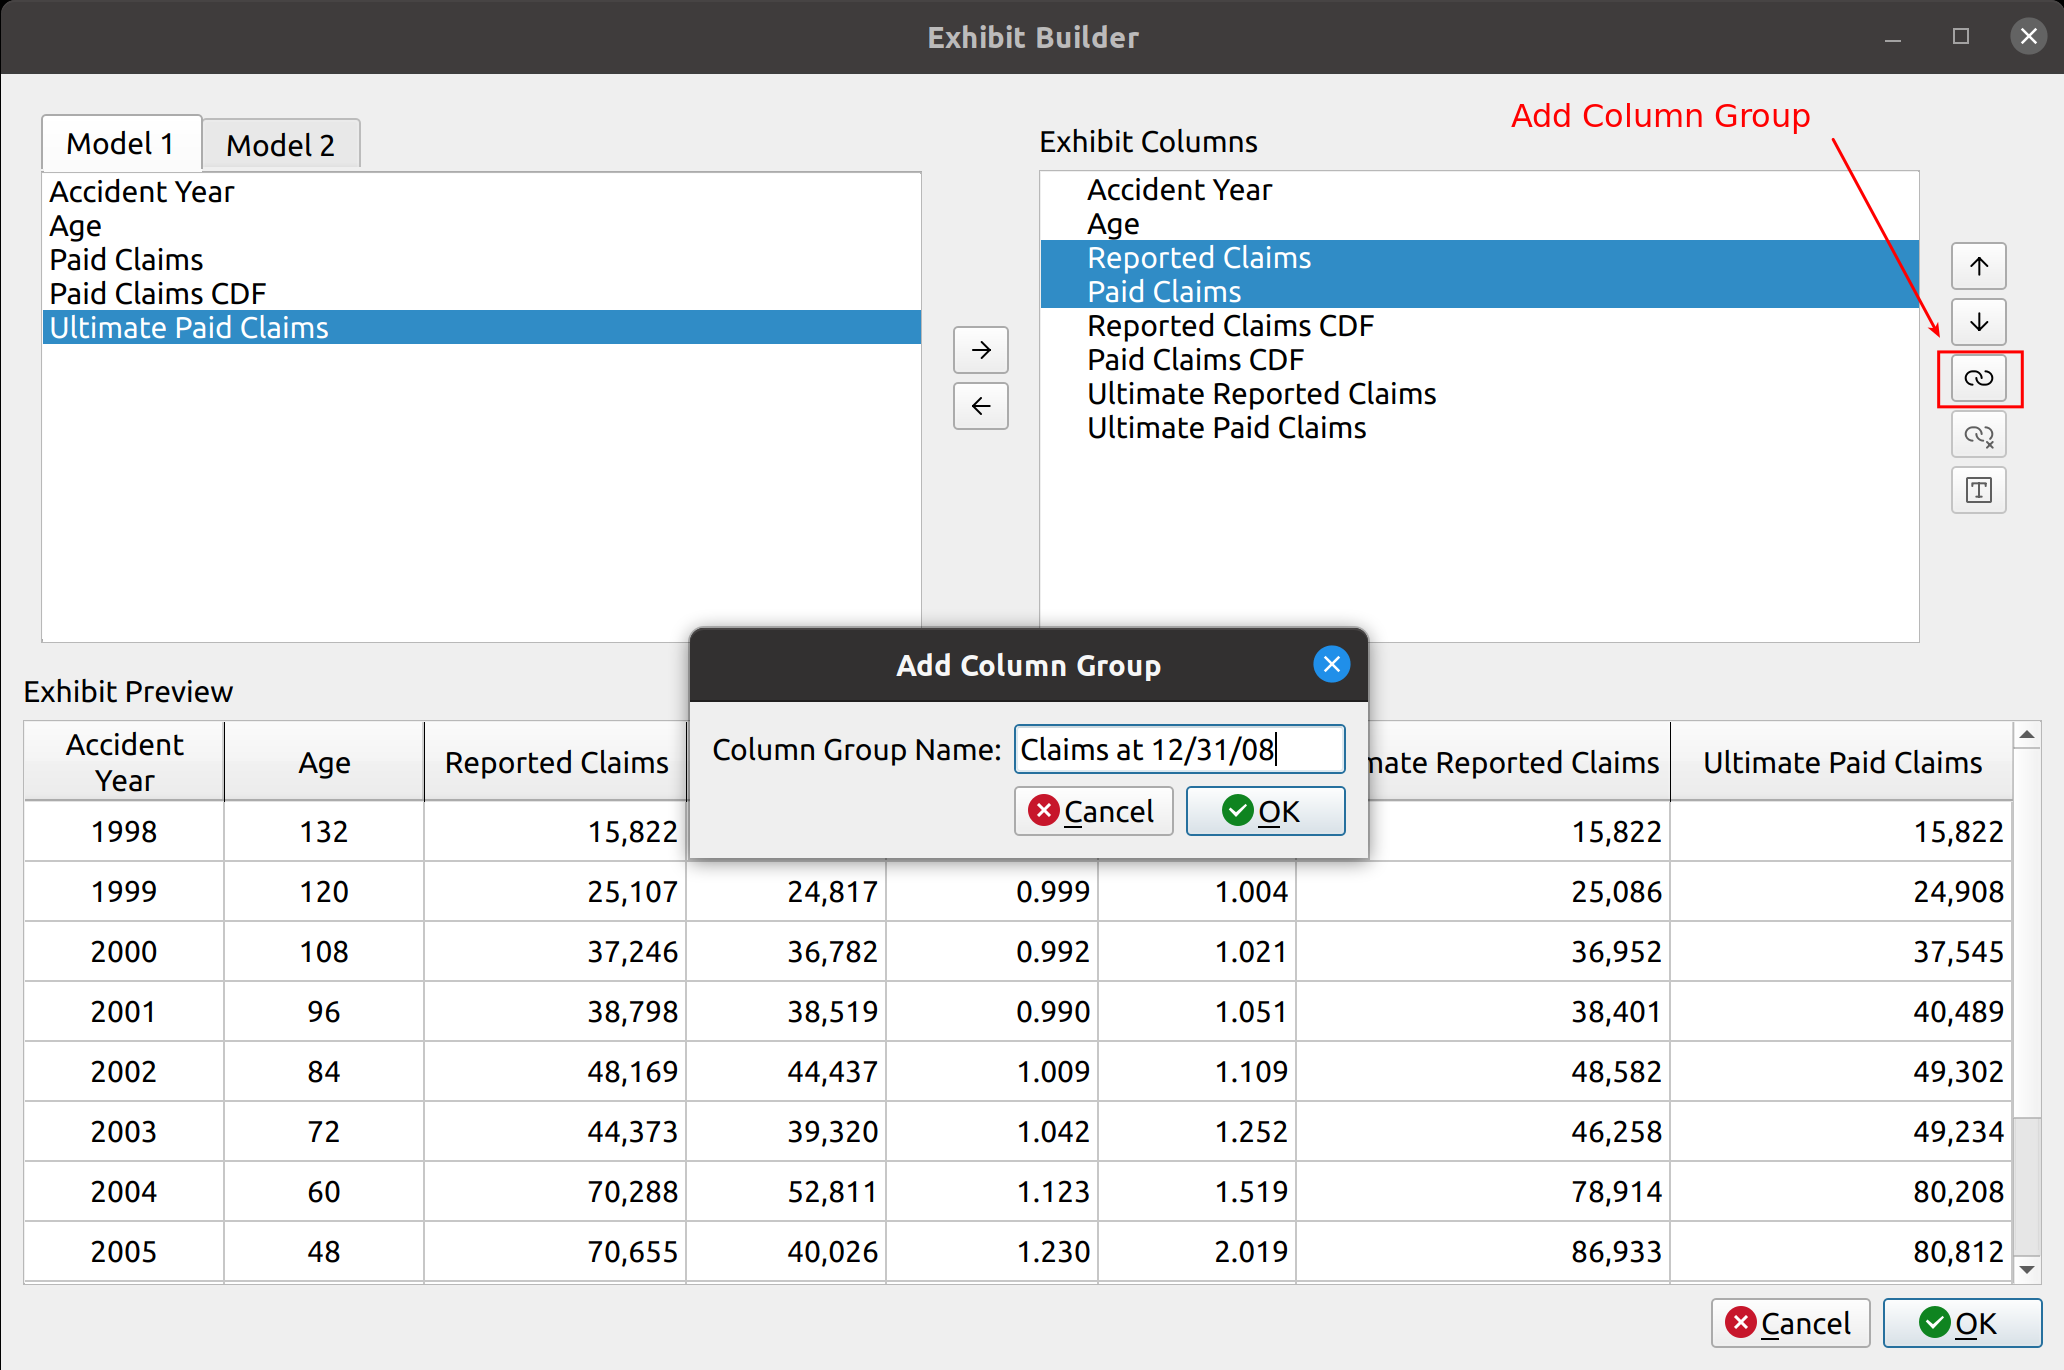
Now We have the right columns, but the headers are unorganized and a bit verbose. Now we can make the hierarchical headers. I call these headers column groups. To make a column group, highlight the columns you want to group from the Exhibit Columns list, and press the “link” button on the right-hand side. A box will pop up asking you to come up with a name for the column group:
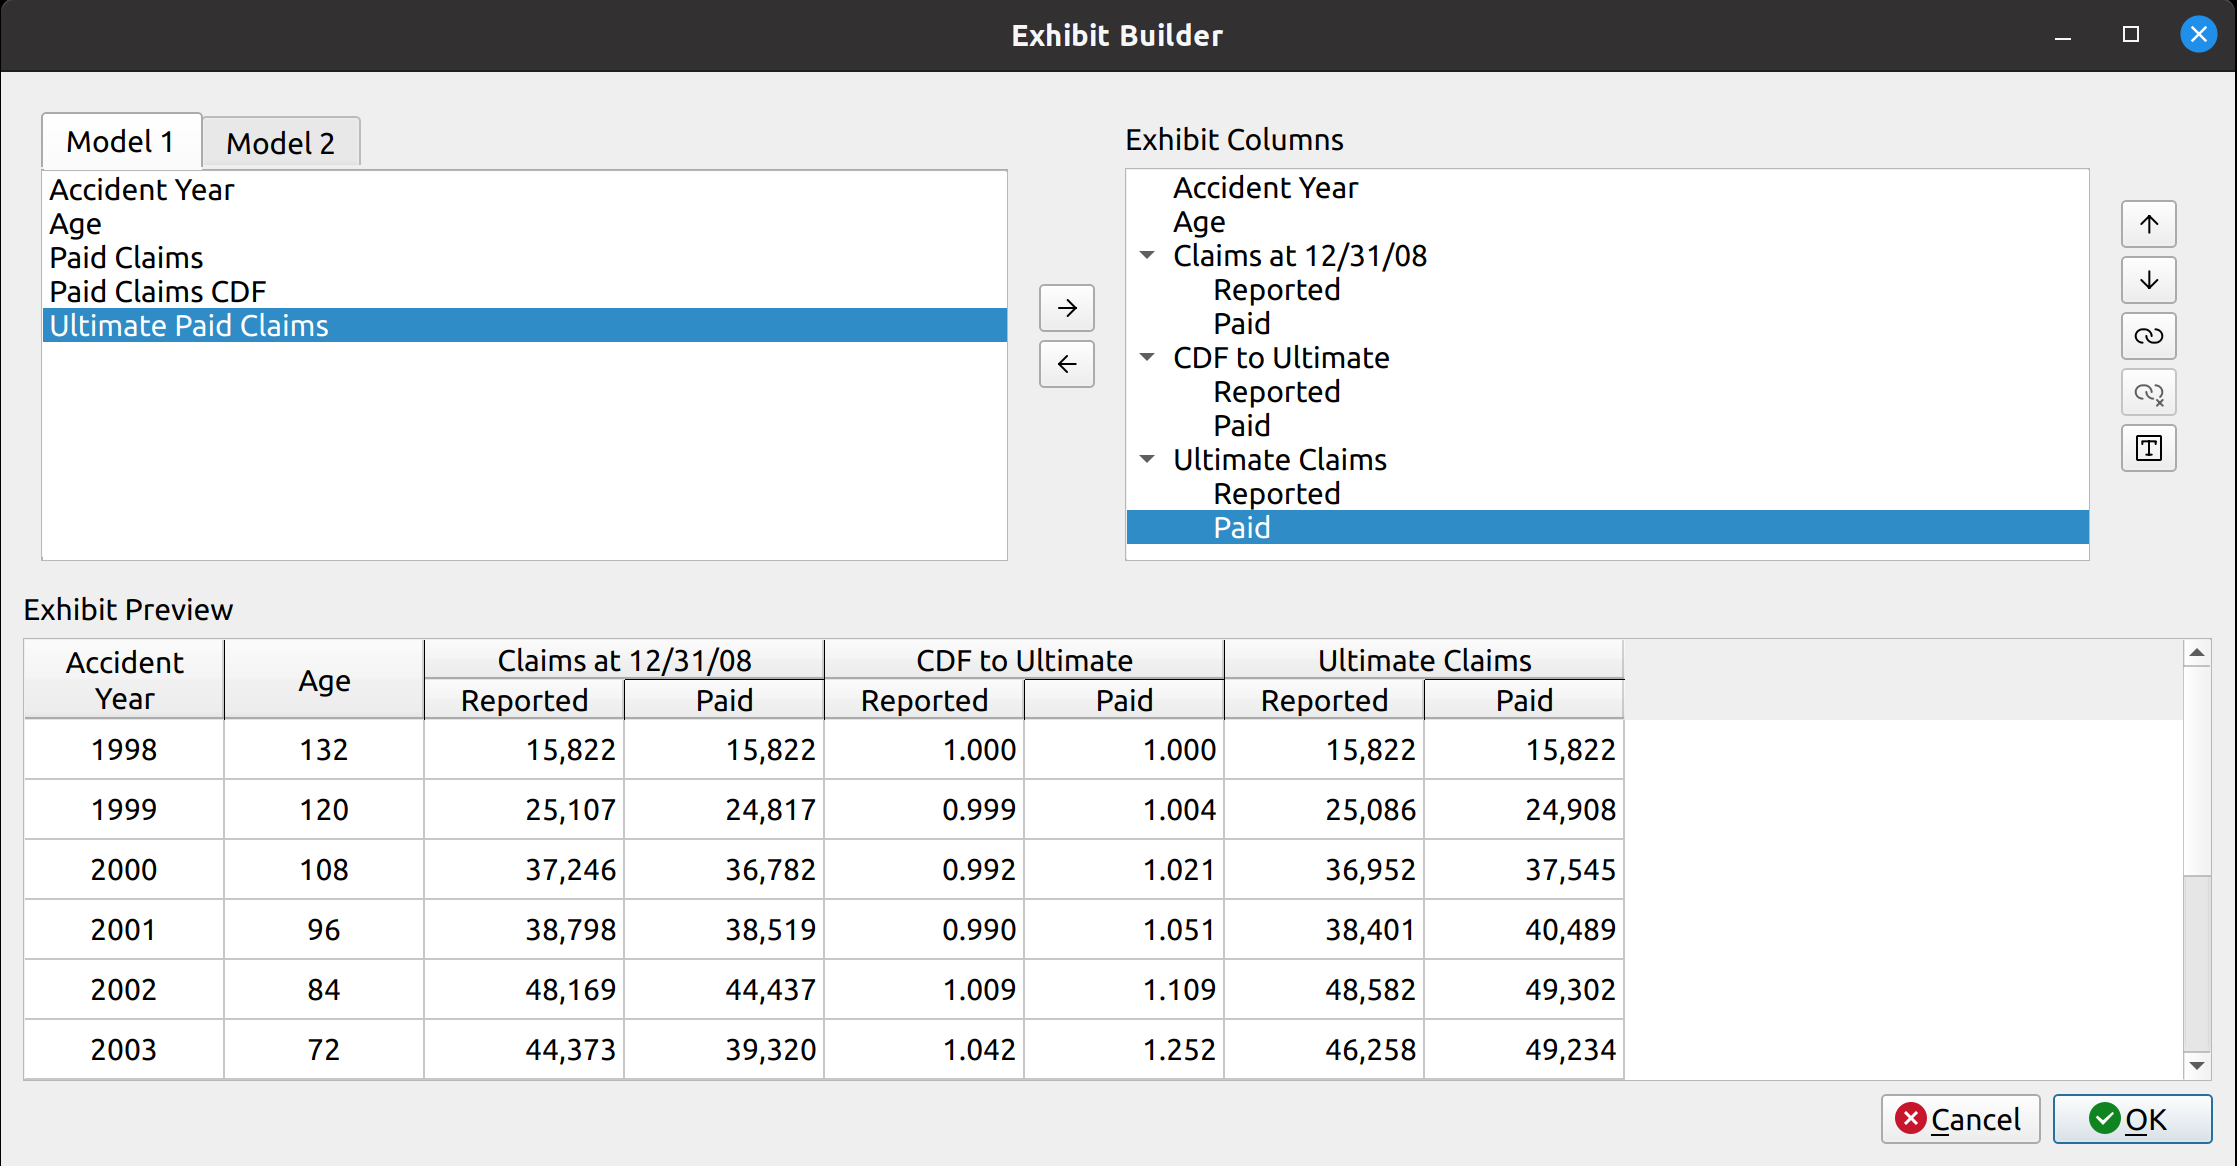
Now we can see that the headers have changed into the hierarchical groupings that we specified:
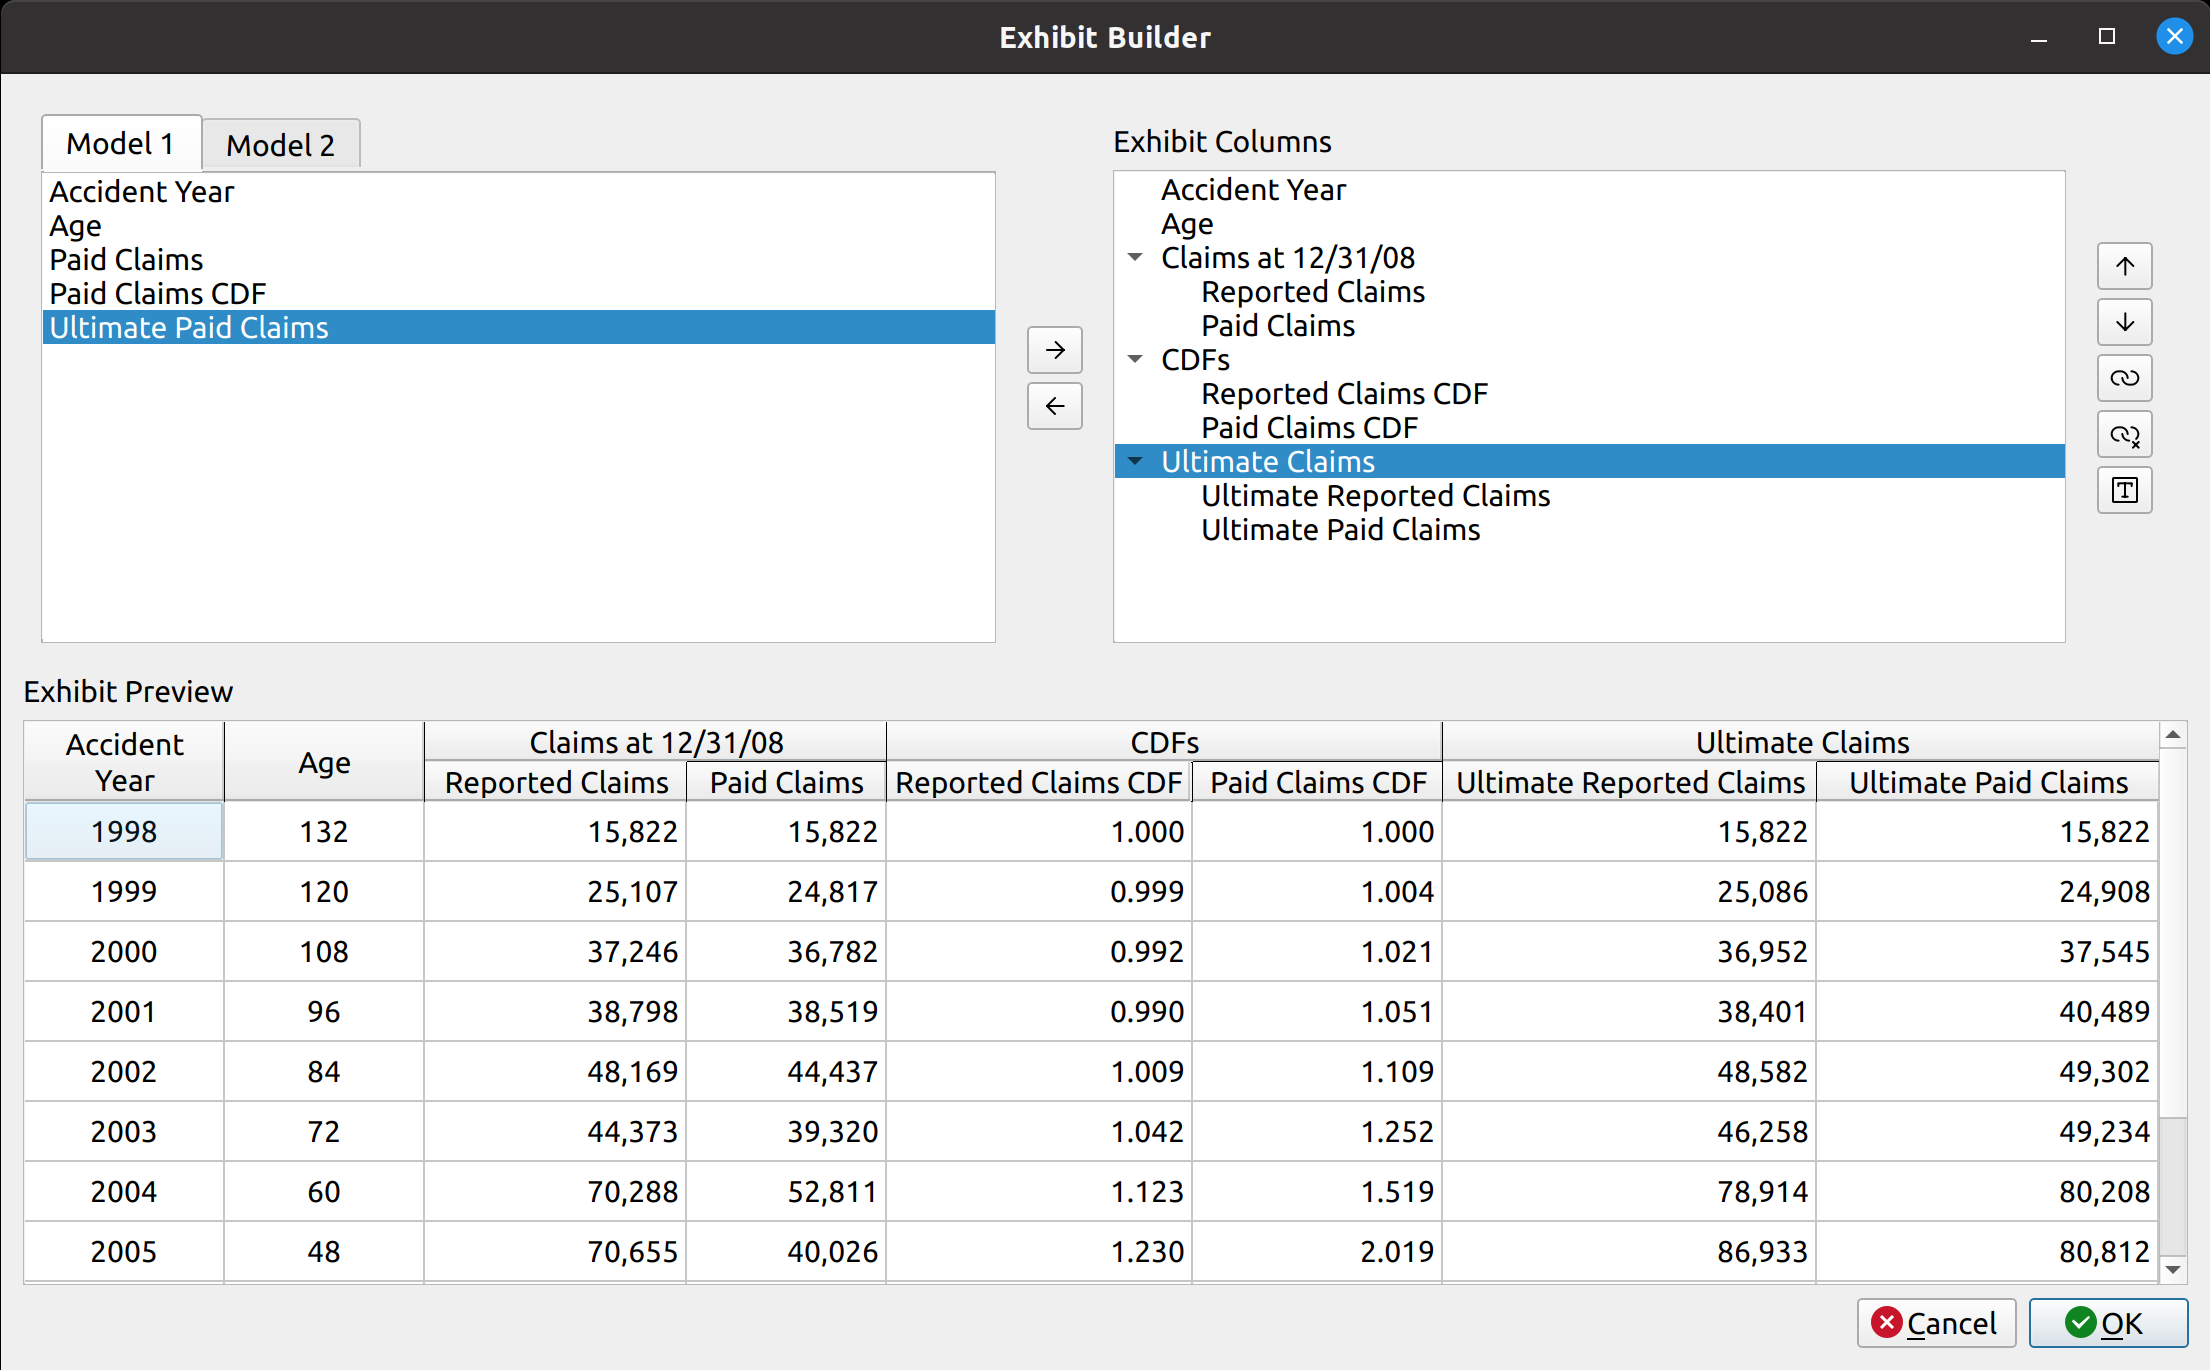
Also, the Exhibit Columns list is now organized as a hierarchical tree, rather than just a flat list.
Renaming Columns
Although we have our column groupings, the sub column labels are too verbose and redundant. We can simplify these by renaming them. To do this, press the “T” button on the right-hand side:
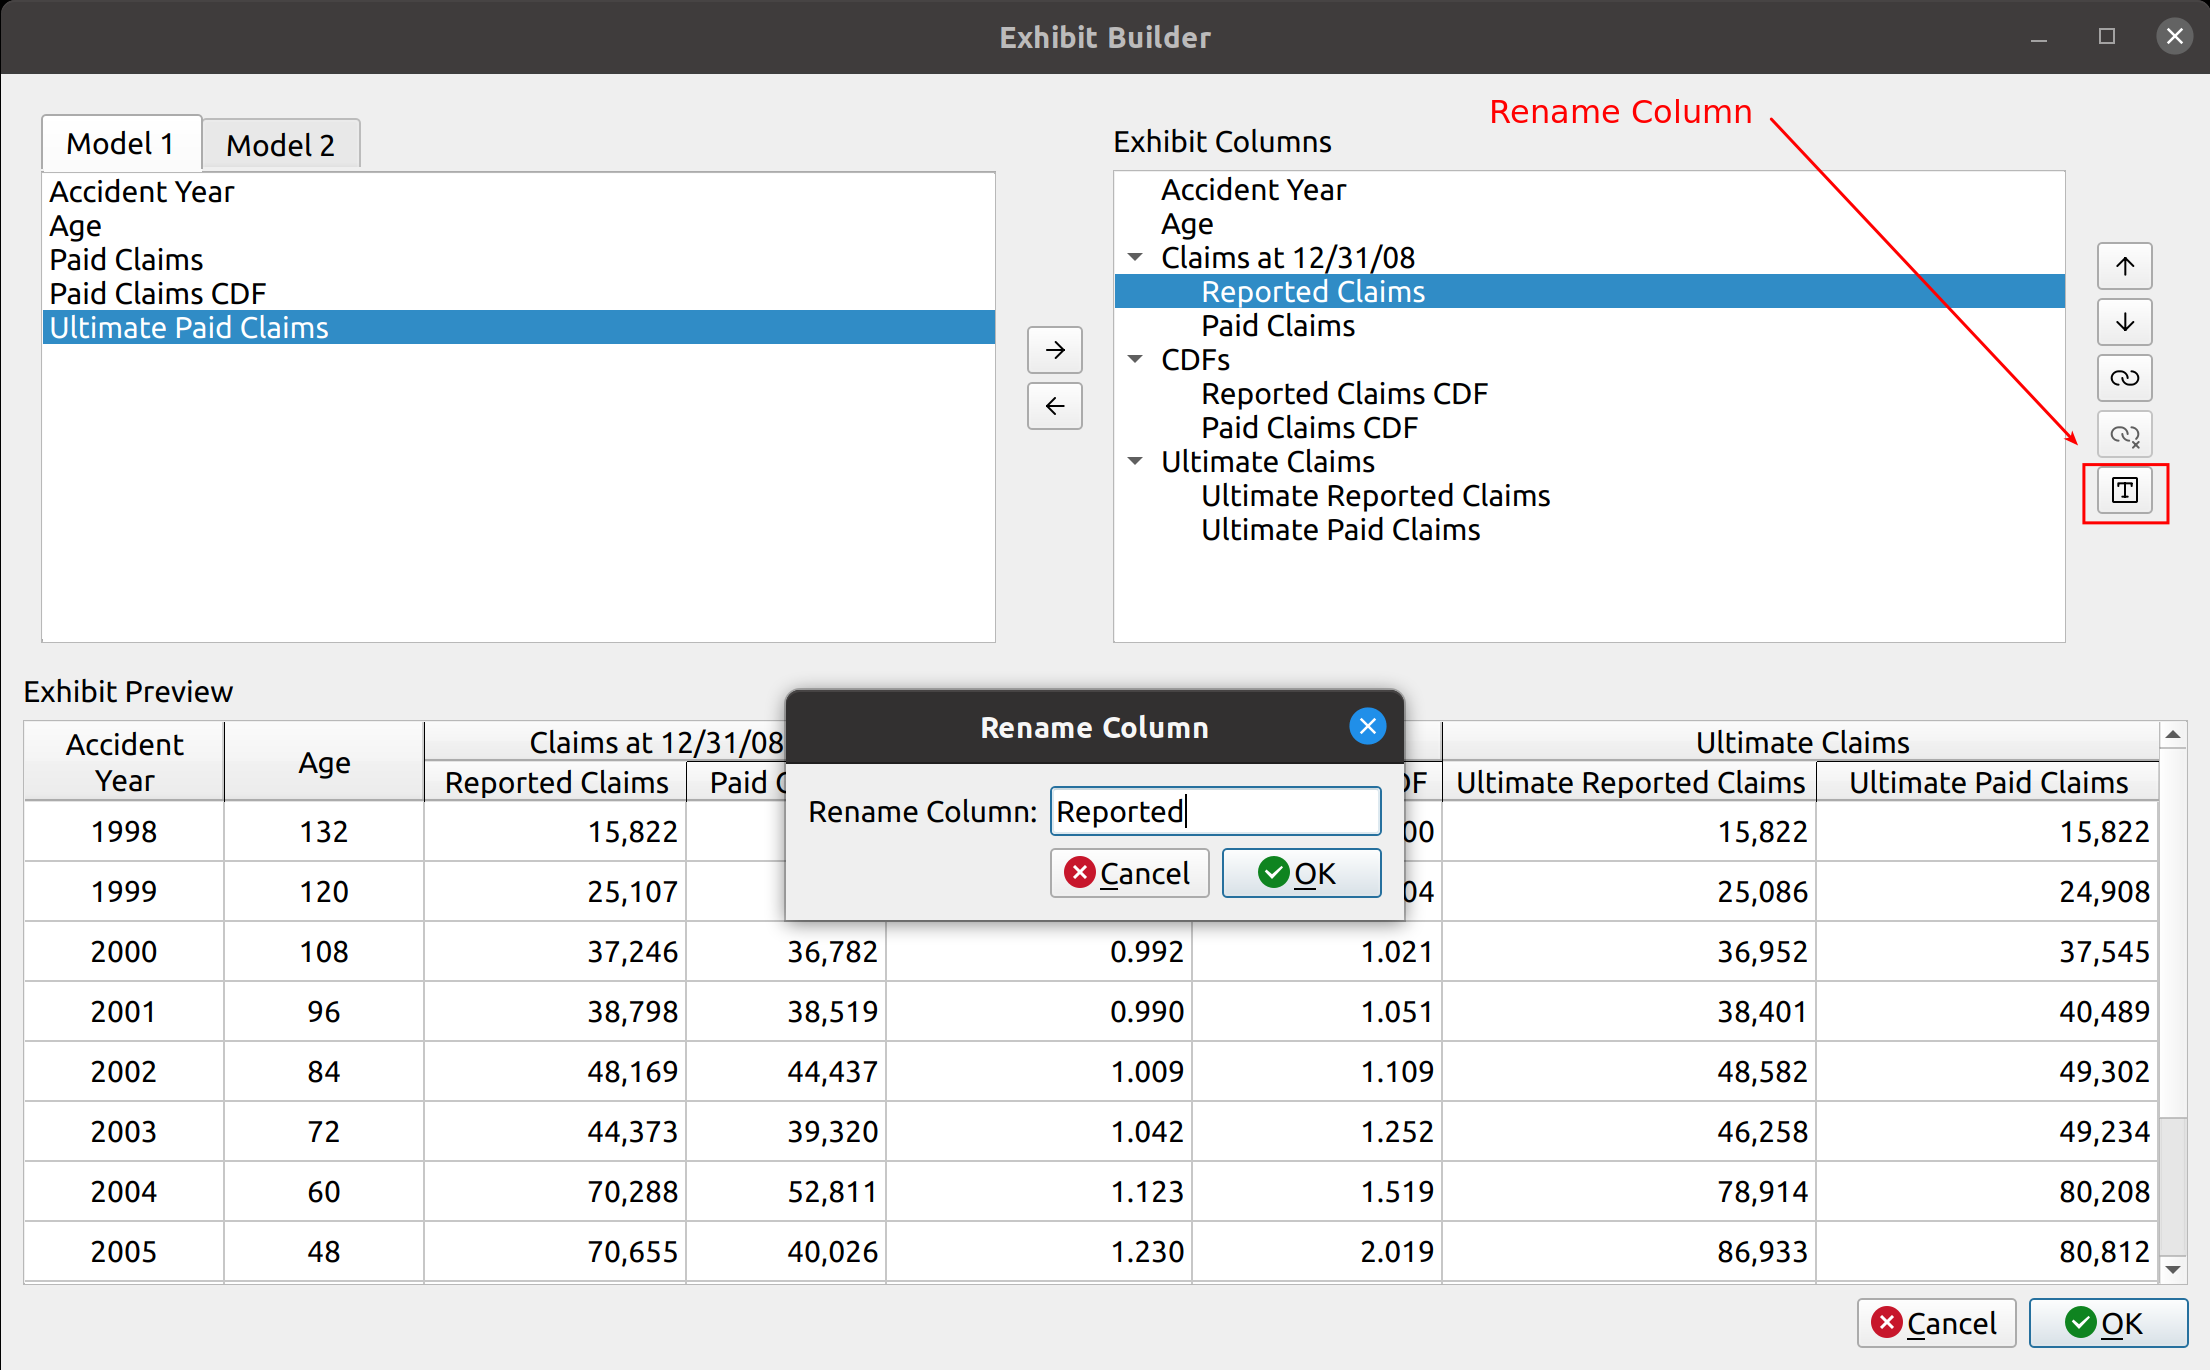
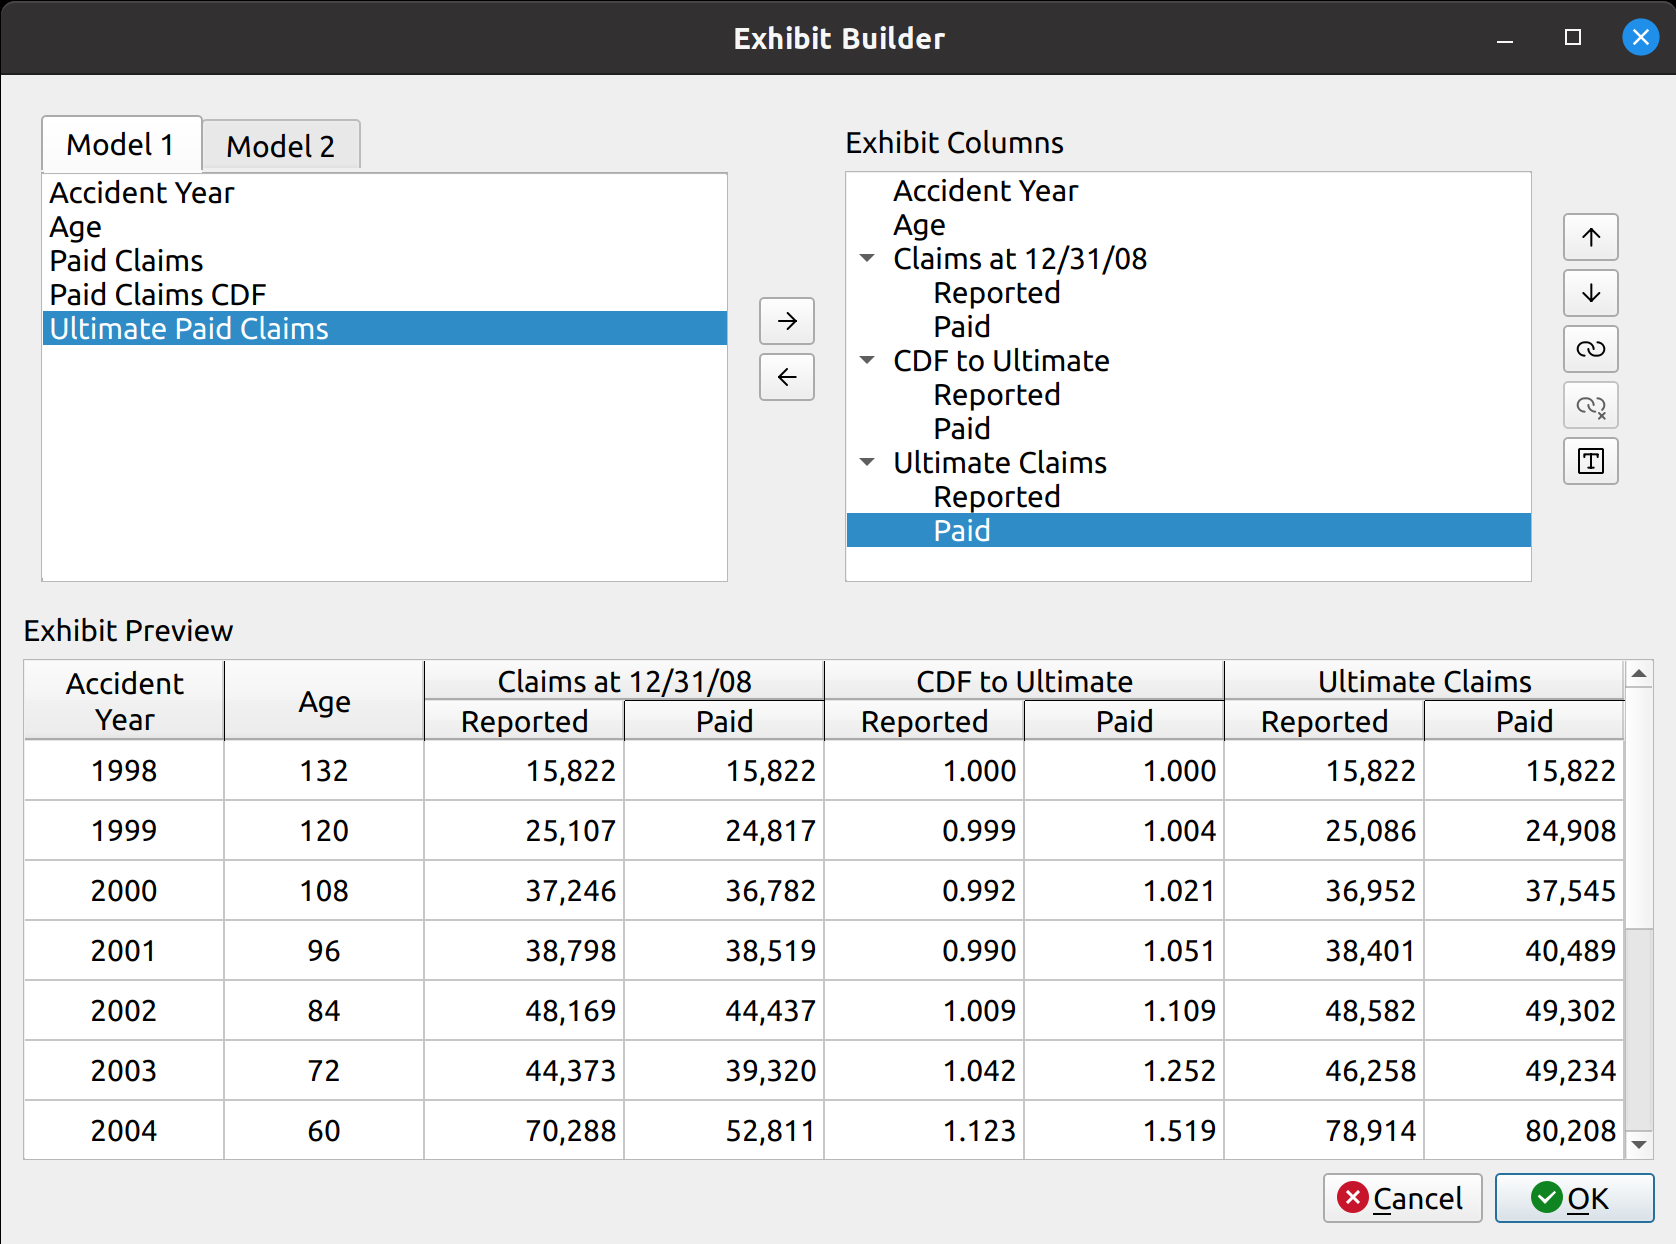
After doing this, we now have the desired exhibit:

Summary
The following video shows the entire process: