Section: 1.6 – Applications of Linear Systems
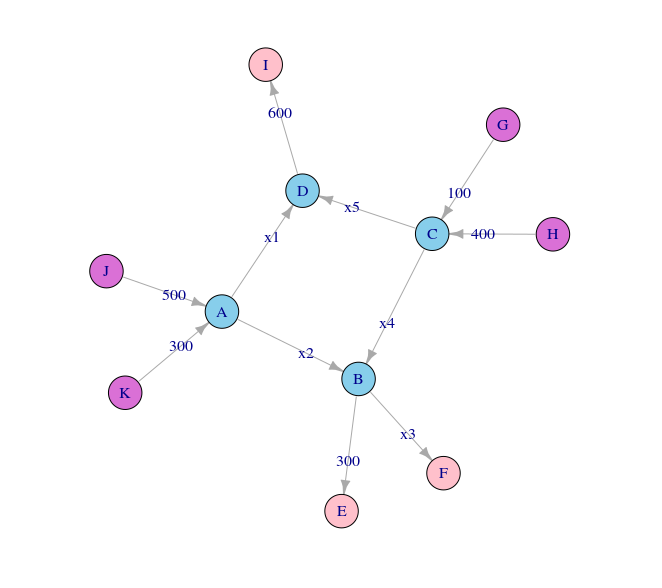
Linear systems can be used to model and solve problems concerning traffic flow. Consider for instance, the following set of intersections modeled by a graph:
The orchid nodes G, H, J, and K represent traffic inflows. The pink nodes E, F, and I represent traffic outflows. The blue nodes A, B, C, and D represent intersections. Each edge (the lines connecting the nodes – representing roads) is labeled with the traffic flow measured in cars per hour. For example, 500 cars travel from J to A each hour. Assuming that for each intersection (and for the network as a whole), that traffic inflow equals traffic outflow, one question arises regarding capacity – how much traffic should the roads x1, x2, x3, x4, and x5 be designed to handle?
First, we need to determine traffic inflows and outflows for each intersection:
| Intersection | Flow In | Flow Out |
|---|---|---|
| A | 300 + 500 | x1 + x2 |
| B | x2 + x4 | 300 + x3 |
| C | 400 + 100 | x4 + x5 |
| D | x1 + x5 | 600 |
In addition, we have the constraint that total network inflow (500 + 300 + 100 + 400) equal total network outflow (300 + x3 + 600), so x3 = 400.
We can use this information to represent the network as a system of linear equations and row reduce the corresponding augmented matrix to solve for the unknowns:
\[\begin{aligned} x_1+x_2&=800\\x_2-x_3+x_4&=300\\x_4+x_5&=500\\x_1+x_5&=600\\x_3&=400\end{aligned}\]
\[\left[\begin{array}{cccccc} 1 & 1 & 0 & 0 & 0 & 800 \\ 0 & 1 & -1 & 1 & 0 & 300 \\ 0 & 0 & 0 & 1 & 1 & 500 \\ 1 & 0 & 0 & 0 & 1 & 600 \\ 0 & 0 & 1 & 0 & 0 & 400 \\ \end{array}\right] \sim \left[\begin{array}{cccccc} 1 & 0 & 0 & 0 & 1 & 600 \\ 0 & 1 & 0 & 0 & -1 & 200 \\ 0 & 0 & 1 & 0 & 0 & 400 \\ 0 & 0 & 0 & 1 & 1 & 500 \\ 0 & 0 & 0 & 0 & 0 & 0 \end{array} \right] \]
Which leads us to the general solution:
\[\left\{\begin{aligned} x_1 & = 600 – x_5 \\ x_2 &=200+x_5 \\ x_3&=400\\x_4&=500-x_5\\x_5&\text{ is free} \end{aligned}\right.\]
Since x5 is free, we have infinitely many solutions to the problem. Thus, in practice, how we actually design the roads would depend on how much traffic we anticipate for x5.
Code used to create the graph
|
1 2 3 4 5 6 7 8 9 10 11 12 13 14 15 16 17 18 19 20 21 22 23 24 25 26 27 28 29 30 31 32 33 34 35 36 37 38 39 40 41 42 43 |
library(igraph) edges <- c("B","E" ,"B","F" ,"A","B" ,"C","B" ,"G","C" ,"H","C" ,"C","D" ,"D","I" ,"J","A" ,"K","A" ,"A","D") edge_labels <- c("300" ,"x3" ,"x2" ,"x4" ,"100" ,"400" ,"x5" ,"600" ,"500" ,"300" ,"x1") cols <- c("skyblue" ,"pink" ,"pink" ,"skyblue" ,"skyblue" ,"orchid" ,"orchid" ,"skyblue" ,"pink" ,"orchid" ,"orchid") traffic <- graph(x) %>% set_edge_attr("label",value=edge_labels) traffic$label <- edge_labels plot(traffic ,vertex.color=cols ,edge.arrow.size=.4 ) |
Code used to solve the equations
|
1 2 3 4 5 6 7 8 |
library(pracma) A = matrix(c(1,1,0,0,0,800 ,0,1,-1,1,0,300 ,0,0,0,1,1,500 ,1,0,0,0,1,600 ,0,0,1,0,0,400) ,nrow=5,ncol=6,byrow=TRUE) rref(A) |
