• Home
  • Readings
  • Github
  • MIES
  • TmVal
  • About
Gene Dan's Blog

Author Archives: Gene Dan

No. 106: A Quick Update

7 July, 2014 9:11 PM / Leave a Comment / Gene Dan

So, (as some of you already know) I had to temporarily halt my 70 Days of Linear Algebra because I had to attend to some extremely important matters over the last few weeks involving some big life changes, but all for a good reason. The outcome is mostly good news, and part of it is that I passed my last actuarial exam which means I have just 4 exams left to go. I will announce the rest of the news later.

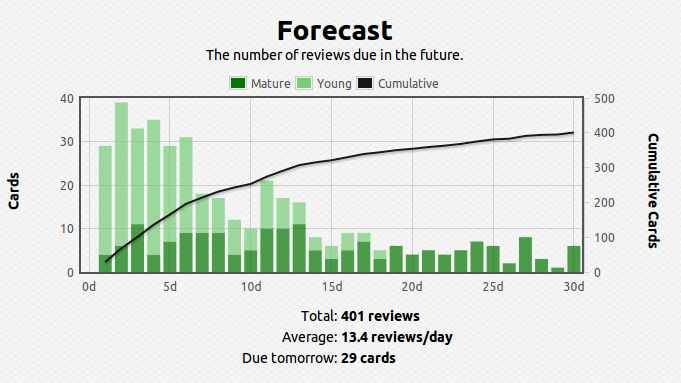
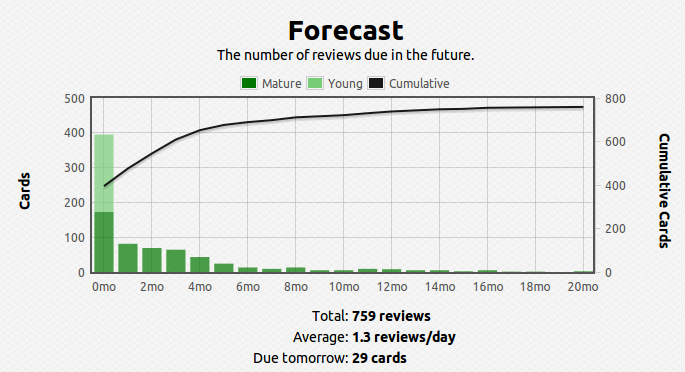
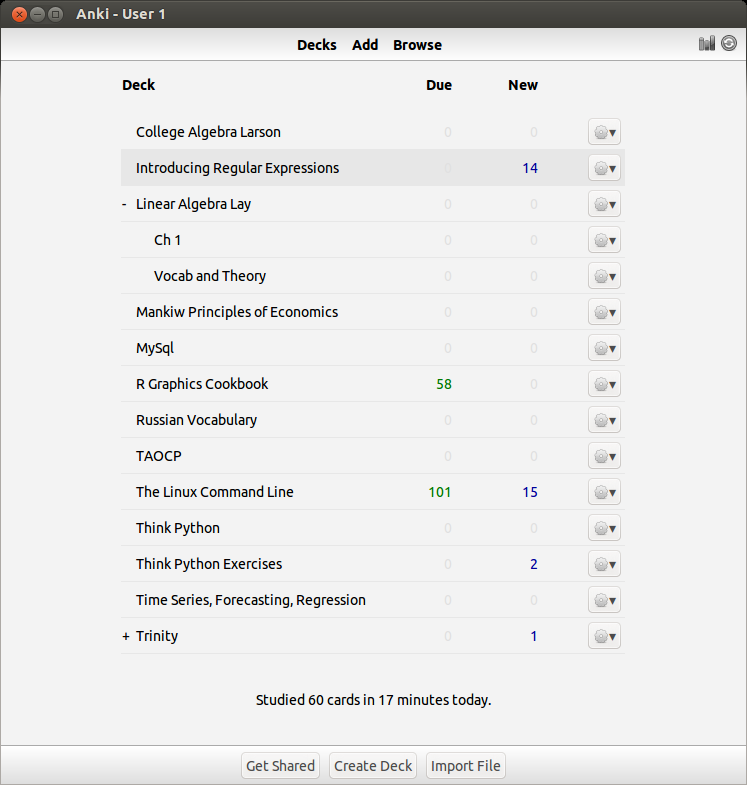
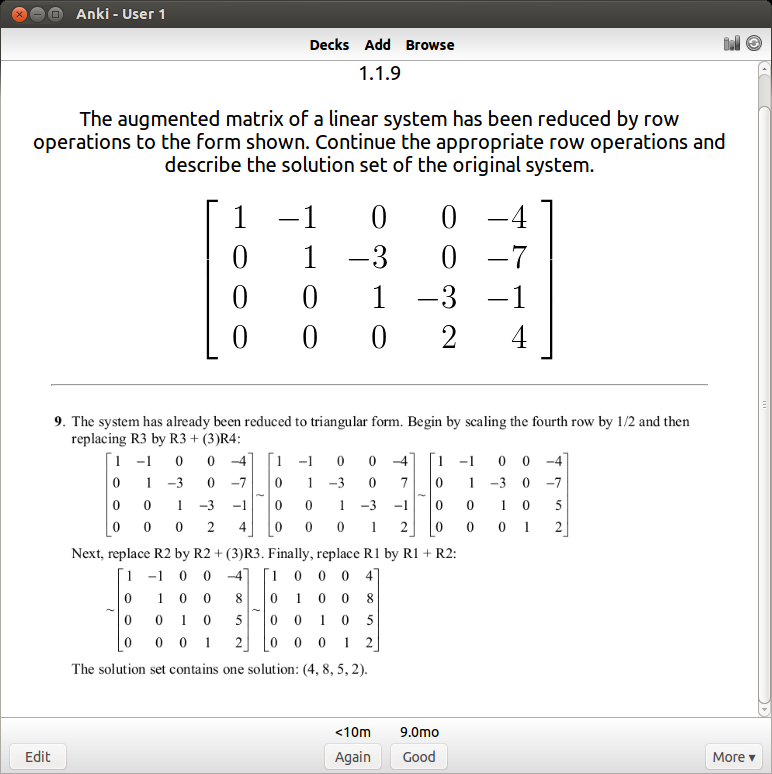
Anyway, I am happy to pick up right where I left off. I have been reviewing my notes using the spaced-repetition techniques I had outlined earlier, so my memory should be fresh.

Posted in: Logs

No. 105: 70 Days of Linear Algebra (Day 8)

11 June, 2014 8:29 AM / Leave a Comment / Gene Dan

Reading: Section 1.8 – Linear Transformations (On Target)
Problems: Section 1.6 – Applications of Linear Systems (Behind – 2 Days)

Well, I was inconveniently incapacitated by a cold last week – I fell behind but I managed to catch up on the reading portion by covering four sections over the weekend. The problems take much longer so I’m still behind on that part. I’m hoping to catch up by this weekend, and then maybe use the July 4th weekend to give myself a cushion just in case I fall behind again.

So far, the problems haven’t been too difficult, aside from some proofing problems and some of the application problems that appear at the end of each section. For example, I had to solve the following vector equation with a computer algebra system (as specified in the problem – otherwise most of the problems are to be done by hand):

\[x_1\left[\begin{array}{c} 27.6 \\ 3100 \\ 250 \end{array}\right] + x_2 \left[\begin{array}{c} 30.2 \\ 6400 \\ 360 \end{array}\right] = \left[\begin{array}{c} 162 \\ 23610 \\ 1623 \end{array}\right] \]

Where \(x_1\) and \(x_1\) represent the tons of anthracite coal and bituminous coal burned at a steam plant, with the two vectors on the left side of the equation representing output (heat, sulfur, dioxide, and particulate matter) from burning these two different types of coal, and the vector on the right representing total output. To solve this equation for \(x_1\) and \(x_1\), we can row reduce the corresponding augmented matrix:

\[\left[\begin{array}{rrr} 27.6 & 30.2 & 162 \\ 3100 & 6400 & 23610 \\ 250 & 360 & 1623 \end{array}\right] \]

The point of the problem is to determine what amounts of each type of coal are required to produce the given amount of heat and waste product. I thought this would be a straightforward problem to solve, but I ran into some trouble when I tried to row reduce the matrix in sage:

ubuntu@ubuntu-desktop: ~-sage-6.2-x86_64-Linux_231

The result above tells me that the system is inconsistent, which to me looked incorrect. I checked my input over and over again for about 30 minutes until I looked up the sage documentation (RTFM, right?) and tried defining the matrix over the ring of rationals (notice the ‘QQ’ in the matrix function below):

ubuntu@ubuntu-desktop: ~-sage-6.2-x86_64-Linux_232

Which produced the correct answer. So it looks like I ran into a precision issue in sage. These are some of the things you have to deal with using open source software – if I knew more about this I could try to fix it – but at least with open source software you have the freedom to try.

Posted in: Uncategorized

No. 104: 70 Days of Linear Algebra (Day 2)

5 June, 2014 7:39 AM / Leave a Comment / Gene Dan

Section: 1.2 – Row Reduction and Echelon Forms
Status: On target

Today I’ll demonstrate a couple of algorithms performed on a 3×4 matrix (we’ll call it A) performed in SAGE. SAGE is an open source computer algebra system intended as an alternative to proprietary systems such as Mathematica, MATLAB, etc. I’ve written about SAGE a few times, here, here and here. To begin, we’ll define A as follows:

\[A=\left[\begin{array}{rrrr} 1 & -2 & 1 & 0 \\ 0 & 2 & -8 & 8 \\ -4 & 5 & 9 & -9 \end{array} \right] \]

To define this matrix in SAGE (actually I think a more modern name would just be “sage”), we can open up the Linux terminal and use Python commands to assign the matrix object to the variable A:

ubuntu@ubuntu-desktop: ~-sage-6.2-x86_64-Linux_226

Those who are familiar with the Python programming language will know that the dir() function returns a list of methods that can act upon an object. Methods are functions that are defined within classes that can act upon instances of those classes. Here, we can use dir() to determine what methods are available to us through sage:ubuntu@ubuntu-desktop: ~-sage-6.2-x86_64-Linux_227

For new users, the variety of methods can be bewildering and somewhat intimidating – but if you look closely you’ll find a method called ‘echelon_form’, which is exactly what we’d guess – a function that returns the row echelon form of our matrix A. Before proceeding, we can type help(A.echelon_form) which confirms that the method does indeed perform the algorithm that most students learn within the first week of their Linear Algebra course (except much faster!):

ubuntu@ubuntu-desktop: ~-sage-6.2-x86_64-Linux_228

Now, typing in A.echelon_form() returns the echelon form of A. The method rref stands for reduced row echelon form, which produces the solution to A’s equivalent linear system:

ubuntu@ubuntu-desktop: ~-sage-6.2-x86_64-Linux_229

As you can see, the solution is the point (29, 16, 3).

Posted in: Logs, Mathematics

No. 103: 70 Days of Linear Algebra (Day 1)

4 June, 2014 8:15 AM / 2 Comments / Gene Dan

So I’ve finally decided to commit to learning linear algebra, and I think this 70-day series of articles will be just what I need to keep myself motivated throughout the process.

On Spaced Repetition

I took a first course on linear algebra during a five-week period my freshman year of college as part of a frantic rush to finish up my economics degree within 2 years. Although ultimately successful, in hindsight this was a bad idea as I immediately forgot the majority of the material within a matter of weeks – covering an entire course within such a short period of time with no reinforcement afterwards led to a failure in committing the material to long-term memory. This would lead to problems later on college as so much of the coursework in applied mathematics, statistics, and economics required the student to have a firm footing in linear algebra.

I didn’t realize it at the time, but during my late high school and early college years I employed a crude method of what is known as spaced repetition, a learning technique geared towards the long-term retention of material. For a given course, my typical study schedule was as follows:

Day 1 – Chapter 1
Day 2 – Chapter 2
Day 3 – Chapter 3
Day 4 – Chapter 4
Day 5 – Chapter 5
Day 6 – Chapters 1 & 6
Day 7 – Chapters 2 & 7
Day 8 – Chapters 3 & 8
Day 9 – Chapters 4 & 9
Day 10 – Chapters 5 & 10

…and so on. This method led to good results for year-end finals and end-of semester exams, but now that it has been several years I find myself struggling to recall the dates of important civil war battles or the names of major dynasties in imperial China. And that’s really a shame since it doesn’t take much more than two repetitions of the material to really make something stick. So two main failures of my study technique were inefficiency and long-term retention. Inefficiency in the sense that I didn’t know how to properly space revisits to the material and failure in long-term retention in the sense that I didn’t revisit the material after the course was over.

Implementation

For more information on spaced-repetition, I suggest reading an excellent article by gwern to understand how it works and what techniques people have used to implement it. The question is now that I have come across this wonderful idea on how to retain information over years, how can I effectively apply these techniques in a practical sense? One of my friends Riley in the actuarial community showed me a physical method for studying life contingencies formulas:

24dpr41

By the time I saw this, I had already been using software, so I found this method hilarious in the sense that this method is impractical once you have a large number of cards, say over 1000, but also ingenious in that someone has managed to apply the technique without the use of a computer.

Like I said, once the number of facts becomes large, figuring out the optimal spacing between revisits of material becomes cumbersome and practically impossible to track – this problem also becomes apparent when the gap between revisits becomes large, say, over a year. To solve this problem I use a software called anki, which digitally stores your cards and calculates the time between reviews automatically. Here’s what my current deck looks like so far over the short and long run:

Selection_220


Selection_221


Anki - User 1_223


Selection_222

You can see that I have about 1400 cards covering various subjects. This technique is extremely efficient – you review the material that you are struggling with multiple times and the material you’ve mastered less often. For example, a typical review card would look like this:

Anki - User 1_224

If I get it right, I won’t see the card again for another 9 months. I’ve actually done this problem several times, so 9 months is an indication that I know it well. If I get it wrong, I have to review it again and the review gap goes back down to zero days. For newer cards, the time until next review will be shorter (4 days).

So, it has taken me quite some time to get to this point – the idea that you can use computers to efficiently commit mathematics to long term memory is incredible. I feel so fortunate to have these tools available to me today. Some technical skills are involved, in particular you need to know LaTeX to get the mathematical notation onto the cards. That itself took a while to learn, but I’m glad I’m finally at the point where I can apply this learning method to mathematics.

There are almost 2,000 problems and 70 sections in David Lay’s linear algebra book, hence, 70 days of linear algebra. I plan to complete all 70 sections problems within 70 days, but that doesn’t mean I will stop doing problems after 70 days, that is just for a first run through the material. Creating a deck of anki cards is actually a very time consuming process, and in that respect I imagine myself only being able to create cards for 2 sections per week. But given that the point of the project is to be able to retain the information over the course of a lifetime, I believe the investment is worth it (I figure if people can use anki to memorize all of Paradise Lost, 2000 problems should be a piece of cake).

Posted in: Mathematics

No. 102: There Will Never be a Perfect Time for Something

17 February, 2014 9:53 PM / Leave a Comment / Gene Dan

I’ve had a hectic last couple months – holiday traveling, family get-togethers, end-of-year projects at work, and so on, and so forth. Despite this, I think I’ve made some big strides in learning the technical skills needed for my upcoming computer projects. In the closing months of 2013, I learned Python. I learned git. I read a 400-page book on how to use the Linux command line. However, every time I felt like I was confident enough to start on a project, I would soon stumble across the latest thing on Hacker News and would have to learn it because it’s the hottest language in the field and every developer will be using it soon.

Haskell you say? Okay, I’ll put in an order for another 350-page book on Amazon. Yes, Haskell, but you need an IDE to edit your code. Alright, that 500-page book on vi and Vim goes into my shopping cart. Okay, no need to worry. It’ll take a while to learn, but this will be the text editor to end all text editors. Then I’ll finally get started on something. But what about Emacs, not everyone uses Vim, maybe you need to learn it to get a better perspective on things. So then another 500-page book goes in the cart. Then I need to learn how to parse text files so yet another book on regular expressions gets added to the cart, then a book on sed, another on grep, and so on, and so forth…

$400 later and enough new books to occupy myself for another 2 years – and I still haven’t gotten past the brainstorming phase on my latest project (to be specific I’m working on some software that will simulate economic markets – but that is a subject for another post). Part of this is a symptom of me not starting programming 10 years ago, but another part of it is that I keep waiting to have the perfect skillset just to start a project. I’ll have to come to grips with myself that my desired state of programming nirvana will never happen.

Every product that reaches the market, and every technology that is developed, will never be perfect. I’m not talking about fatal design flaws that lead to product failure, but imperfection in the sense that human wants and needs will continue to evolve, and under these circumstances, existing products will need to be improved or redesigned to meet the needs of the future. On the other hand, as a designer, you want to be able to anticipate anything that can go wrong with a product. However, the fear of failure can be crippling and in the end, you never get anything done as a result. But it’s not really until you get your product into the hands of other people that you really get to see where improvements can be made, and such feedback is vital to the designer. The key is that you need to make your creation improve the human condition in some way, even if it’s not perfect. As your product, and the ideas and innovations that come along with it – are circulated throughout the population, only then does it allow other people build upon what you’ve done and to create new ideas of their own. Then, life marches on. But if your ideas never get executed, nothing happens, and humanity leaves you behind.


– P.S. –

You may have noticed that I added a github link to the top of the page. There’s not much on it currently, but I did create and give a presentation on dynamic documents at the Houston Visualization Meetup two weeks ago. You can view the presentation materials here. In the meantime, I will be updating the repositories daily.

Posted in: Logs / Tagged: databases, economics, github, RDBMS, relational databases, simulation

Post Navigation

« Previous 1 … 8 9 10 11 12 … 30 Next »

Archives

  • September 2023
  • February 2023
  • January 2023
  • October 2022
  • March 2022
  • February 2022
  • December 2021
  • July 2020
  • June 2020
  • May 2020
  • May 2019
  • April 2019
  • November 2018
  • September 2018
  • August 2018
  • December 2017
  • July 2017
  • March 2017
  • November 2016
  • December 2014
  • November 2014
  • October 2014
  • August 2014
  • July 2014
  • June 2014
  • February 2014
  • December 2013
  • October 2013
  • August 2013
  • July 2013
  • June 2013
  • March 2013
  • January 2013
  • November 2012
  • October 2012
  • September 2012
  • August 2012
  • July 2012
  • June 2012
  • May 2012
  • April 2012
  • March 2012
  • February 2012
  • January 2012
  • December 2011
  • September 2011
  • August 2011
  • July 2011
  • June 2011
  • January 2011
  • December 2010
  • October 2010
  • September 2010
  • August 2010
  • June 2010
  • May 2010
  • April 2010
  • March 2010
  • September 2009
  • August 2009
  • May 2009
  • December 2008

Categories

  • Actuarial
  • Cycling
  • Logs
  • Mathematics
  • MIES
  • Music
  • Uncategorized

Links

Cyclingnews
Jason Lee
Knitted Together
Megan Turley
Shama Cycles
Shama Cycles Blog
South Central Collegiate Cycling Conference
Texas Bicycle Racing Association
Texbiker.net
Tiffany Chan
USA Cycling
VeloNews

Texas Cycling

Cameron Lindsay
Jacob Dodson
Ken Day
Texas Cycling
Texas Cycling Blog
Whitney Schultz
© Copyright 2025 - Gene Dan's Blog
Infinity Theme by DesignCoral / WordPress