• Home
  • Readings
  • Github
  • MIES
  • TmVal
  • About
Gene Dan's Blog

Author Archives: Gene Dan

No. 91: Learning Linear Algebra

15 July, 2013 8:44 PM / 1 Comment / Gene Dan

I started learning linear algebra a couple weeks ago. I’m taking a three-pronged approach to study:

Linear Algebra – David Lay

Lay’s book isn’t very heavy on theory and mostly covers matrix computations. I took an introductory course in Linear Algebra over a five-week period back in 2007, so I’ve already done most of the problems in this book. However, since the course was so short, naturally cramming was involved as I scrambled to cover the entire textbook in a little more than a month – so with respect to this I didn’t benefit from the spacing effect to commit the things I learned into long-term memory. I think a review would be helpful since my current job duties demand that I understand matrices well.

Introduction to Linear Algebra – Serge Lang

Serge Lang wrote an introductory text that is a little bit more theoretically rigorous than Lay’s book. This reading is pretty short at 280 pages, and contains a modest number of problems (328). I’m reading this mostly at a pretty slow pace (4 pages a day), so I should be done in about 2 months. This mainly serves as a supplementary text to Lay.

Sage

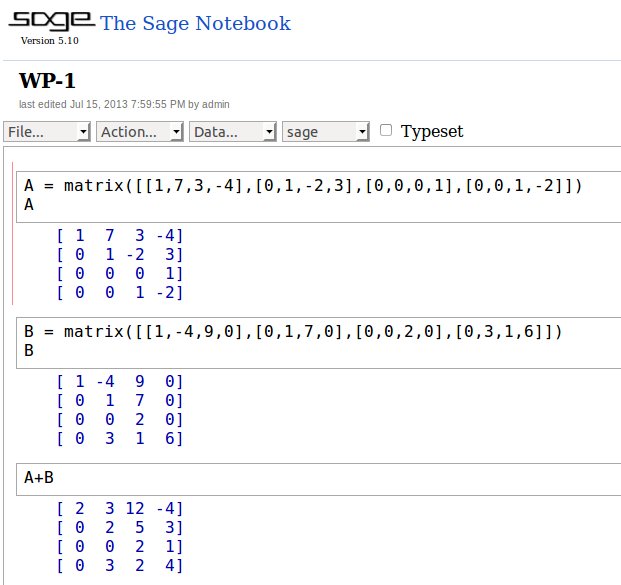
I wrote about Sage a couple years ago, and I’m finally putting it to use to help myself learn linear algebra. Sage is an open-source project aimed at creating a free, viable alternative to proprietary computer algebra systems such as Mathematica, Matlab, and Maple. I’m starting out by reading the Sage Tutorial and applying the built-in commands to the problems from Lay’s book. For example, here is a screenshot of the Sage Notebook:

SageNb

Here, you can see three cells of code along with output for each one. The first cell contains two commands, one to declare a matrix A, and another to show it:

\[A=\left[ \begin{array}{rrrr} 1 & 7 & 3 & -4\\0 & 1 & -2 & 3 \\0 & 0 & 0 & 1 \\ 0 & 0 & 1 & -2 \end{array} \right] \]

The second cell declares and prints matrix B:

\[B=\left[ \begin{array}{rrrr} 1 & -4 & 9 & 0\\0 & 1 & 7 & 0\\0 & 0 & 2 & 0\\0 & 3 & 1 & 6 \end{array} \right] \]

The third cell adds the two matrices together:

\[A+B=\left[ \begin{array}{rrrr} 1 & 7 & 3 & -4\\0 & 1 & -2 & 3 \\0 & 0 & 0 & 1 \\ 0 & 0 & 1 & -2 \end{array} \right]+\left[ \begin{array}{rrrr} 1 & -4 & 9 & 0\\0 & 1 & 7 & 0\\0 & 0 & 2 & 0\\0 & 3 & 1 & 6 \end{array} \right]=\left[ \begin{array}{rrrr} 2 & 3 & 12 & -4\\0 & 2 & 5 & 3\\0 & 0 & 2 & 1\\0 & 3 & 2 & 4 \end{array} \right]\]

Vector Addition

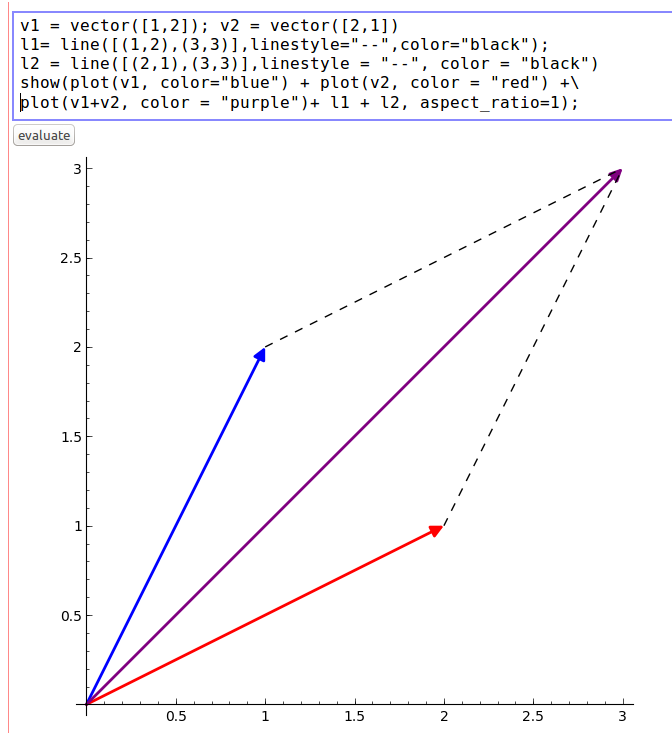
I really like Sage’s plotting capabilities. The following example declares two vectors, v1 and v2, and plots their sum, which is also a vector. v1 is blue, v2 is red, and the vector sum is purple:

SageNb4


I added some dashed lines (which are declared as l1 and l2 in the cell) to complete the parallelogram in the plot. This shows that the sum of two vectors can be represented as the fourth vertex of the parallelogram where the other three vertices are its component vectors and the origin.

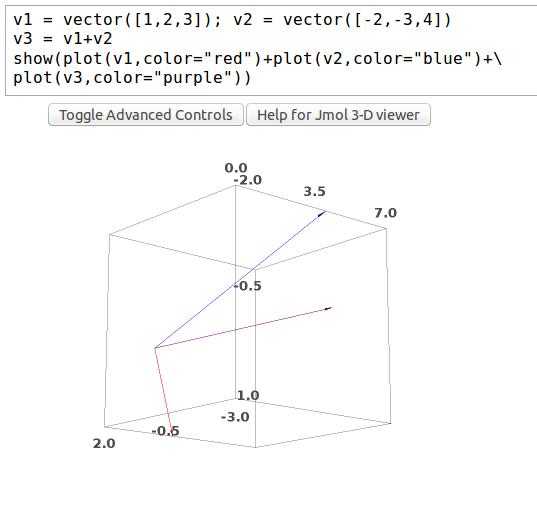
Sage also has 3D plotting capabilities. The following example shows the sum of two vectors in three-space along with its components:
SageNb5

Posted in: Logs, Mathematics / Tagged: david lay linear algebra, introduction to linear algebra, linear algebra, sagemath, serge lang, vector plot sage

No. 90: The Houston Machine Learning Group

1 July, 2013 8:02 PM / Leave a Comment / Gene Dan

Last month I received a message from Pankaj Maheshwari to join a new meetup group called The Houston Machine Learning Group. I’d been interested in machine learning for quite some time, so I decided to sign up out of curiosity. Within a couple of days, Pankaj was able to gather about 20 of us together, and we all decided to meet up last week at Platform Houston, which is a development space at Rice Village where startups work.

As usual, the Rice Village area was packed full of cars and people, and parking was difficult. After I managed to find a spot, I walked over to Platform Houston and introduced myself to the other members, who represented a wide range of industries like oil & gas, biotech, finance, academia, and software engineering. I found the other members to be very friendly and highly intelligent – after we introduced ourselves, Pankaj told us that he started the group because he noticed that Houston was home to many industries that could benefit from machine learning, but did not have a machine learning community from which to draw talent and share ideas.

The meeting got off to a slow start, but after we got acquainted with each other, we came up with several ideas of projects we could work on, many of which I thought were interesting:

Biotech – Hospitals routinely collect biometric data on their patients, but it wasn’t until recently that they were able to store large quantities of real-time data (one member mentioned that a hospital could store up to a terabyte a day worth of data). The amount of data has gotten so large that it has become difficult to analyze by human means – and machine learning could help discover patterns that we would otherwise miss. For example, imagine a world where each of the nation’s hospitals were linked together via a communications network, and machine learning was able to detect emerging pandemics based on patient data. This would allow governmental organizations such as the CDC to react quickly to such events – which would potentially save millions of lives.

Oil & Gas – Machine learning could optimize the supply chains of oil & gas companies.

Finance & Energy Trading – Machine learning can accurately interpret and place trade orders by analyzing text via natural language processing.

Voting – Machine learning can discover patterns amongst voting populations – this would have a direct impact on political campaigns, and may also keep politicians better informed of their constituents’ interests once they arrive in office.

Traffic – Machine learning could analyze traffic patterns in metropolitan areas to help traffic engineers optimize flow.

Pankaj himself is the founder of two startups, one of which is very close to my workplace called Net Matrix Solutions, which is an IT staffing firm. He expressed an interest in Kurweil, technological singularity, and had the ambitious goal of enabling computers to not only learn from large datasets, but to also be curious about the patterns discovered via learning. He told us that he currently spends 2-3 hours a day looking into machine learning.

Overall, I thought the meetup was very fun, and I really enjoyed meeting people with similar interests. I’m pretty excited to be involved in the group and its projects over the near future.
2262bd2783b604ef158106c28159d5c5

Posted in: Logs / Tagged: data science, houston, machine learning, the houston machine learning group

No. 89: Skipping Ahead

24 June, 2013 7:46 PM / 2 Comments / Gene Dan

I mentioned a few weeks ago that I’m spending about 30 minutes each day reading material that’s beyond my technical level of understanding. I‘ve been reading Data Mining at a rate of about 10 pages per day, with a strict limit of no more than 3 minutes per page. The first couple of chapters were pretty easy – they covered some of the basic goals of machine learning, such as pattern recognition and classification. The third chapter was a bit more technical than the first two, and now that I’m on the fourth chapter, I feel almost completely lost, especially when trying to understand the examples covering unfamiliar concepts like information theory and entropy.

There are few benefits to reading unfamiliar material – I think by doing so you’ll get a good idea of the subject’s prerequisites. In the case of data mining, I’ve learned that I’ll need to look in to algorithms and information theory. There were also some paragraphs that covered Bayesian statistics, which I studied last year but have gotten a bit rusty at – however, the inclusion of the subject indicates that I ought to review it if I want to have a deep understanding of how data mining works.

Data mining has some direct applications to actuarial work. For example, insurance companies need to divide policyholders into subsets and price the policies based on shared attributes amongst the policyholders in each subset. An example of this practice would be to charge the owner of a commercial supertanker a higher premium for a commercial shipping policy than the owner of a small tugboat. This is because the supertanker has a larger expected loss than the tugboat. This type of segmentation is currently done using a combination of basic statistics and business judgement (marketing, operating costs, etc.). Segmentation is easy when you think of extreme examples, like the one I just pointed out (based on size), however it becomes more difficult when you include other attributes such as age, manufacturer, where the ship is predominantly moored, and the climate of the geographic region where the ship travels on business. There might be significant overlap amongst individual ships regarding these categories, which makes classification difficult. In addition to the problem on how to classify ships, you also have the dilemma of choosing the optimal number of categories, the optimal size of each category, and the boundaries of each category.

Data mining aims to resolve this issue by quickly scanning large datasets and looking for similarities amongst ships that an actuary or underwriter would otherwise miss via traditional methods. Data mining isn’t widely used in the industry, but it’s quickly gaining ground as the rapid expansion in data-collecting technology has made such efforts feasible. I think it has the potential to significantly change the industry with respect to the way insurers price policies, and this is why I’ve become interested in the field.

I think data mining also has some very interesting applications in biology – for instance, you might remember learning about animal kingdoms back in grade school. I myself was taught that there were five, but nowadays a 6-kingdom classification system is popular in U.S. biology classrooms (some advocate for even more kingdoms). Taxonomy, which includes grouping organisms into kingdoms, as well as into separate species, is a problem that can be addressed with data mining. The following diagram looks as if the person who made it was trying to divide a dataset into two categories:

k-meansThis reminded me of a case example in the Data Mining book on whether or not a dataset of flowers should be divided into two separate categories. The above image isn’t the same thing (although it looks similar to the graphic in the book), I just thought it was a pretty image that would look nice with this blog post. Apparently, the image is the result of a failed attempt at k-means clustering (I’m not going to pretend that I know what it means).

In the meantime I’ve been making some good progress in learning linear algebra, which is well within reach for me in terms of difficulty. I’ll also be going to a Houston Machine Learning Group meeting later this week, and if I find it interesting I’ll be writing about it here.

Posted in: Logs / Tagged: data mining

No. 88: Communicating Mathematics via LaTeX

17 June, 2013 8:40 PM / Leave a Comment / Gene Dan

I started learning LaTeX a couple of years ago, but it wasn’t until last year when I started studying for actuarial exams 4/C and 3/MFE that I really started to become proficient at using it. If you are not familiar with what LaTeX is, it’s a markup language that lets you easily (although it takes some effort to learn) write mathematical formulas on a computer screen by using the keyboard. For example, \[ f(x) = \frac{1}{\sigma\sqrt{2\pi}}\mathrm{e}^{-\frac{(x-\mu)^2}{2\sigma^2}} !\], which is the code written in the WordPress editor, produces the formula for the Normal Distribution:

\[ f(x) = \frac{1}{\sigma\sqrt{2\pi}}\mathrm{e}^{-\frac{(x-\mu)^2}{2\sigma^2}} \]

You can try to write the above formula by using Microsoft Equation editor (like many of us did as highschoolers), but you’ll quickly realize that it takes an extremely long time, and you’ll be wishing that you had a faster, more efficient way of writing mathematical notation – this is where the usefulness of LaTeX becomes apparent.

I started using LaTeX while posting in the actuarial message boards, which are popular amongst candidates who are trying to study for exams. The bulletin board system has a LaTeX compiler installed, so you can easily consult other students from all across the world. For example, if I’m studying at 2:00 AM in the morning, I can post a question on the message board and there will most likely be someone who is awake at that time in Europe or China who would be willing to answer that question.

There are some more well-known message boards as well, such as StackOverflow and MathOverflow, where people (mostly from technical backgrounds) ask each other questions. Oftentimes they’ll use LaTeX to write technical notation – which greatly facilitates communication. I’ve found StackOverflow to be very helpful from time to time. On the other hand, I can’t even understand most of the questions being asked in MathOverflow, which is an online community of mathematicians asking each other research-level questions pertaining to mathematics. Fortunately, there’s another site under the StackExchange umbrella called Mathematics Stack Exachange, which caters to undergraduate and early graduate-level students, and is much more accessible. These websites are only 4 years old and have already made a huge impact on the way people collaborate on technical projects. I’m not sure if Don Knuth imagined this when he invented TeX way back in 1978, but if he did, he had tremendous foresight.

I’ll close by demonstrating a problem on matrices, which I started studying last week. I covered the basic row operations on matrices and today I just went over spanning and matrix equations in the Ax=b form. It’s been very interesting going back to material that I first learned 5 years ago – I have a different perspective now and it’s much like watching a movie – you always pick up something new the second time around.

Problem:

Solve the system of equations:

\[\begin{aligned} x_1 – 3x_3 &= 8 \\ 2x_1 + 2x_2 +9x_3 &= 7 \\ x_2 + 5x_3 &= -2 \end{aligned}\]

Solution:

We’ll start by writing the augmented matrix of this system of equations:

\[\left[ \begin{array}{rrrr} 1 & 0 & -3 & 8 \\ 2 & 2 & 9 & 7 \\ 0 & 1 & 5 & -2 \end{array} \right] \]

Replace row 2 with the sum of row 2 and negative 2 times row 1:

\[\left[ \begin{array}{rrrr} 1 & 0 & -3 & 8 \\ 0 & 2 & 15 & -9 \\ 0 & 1 & 5 & -2 \end{array} \right] \]

Interchange rows 2 and 3:

\[\left[ \begin{array}{rrrr} 1 & 0 & -3 & 8 \\ 0 & 1 & 5 & -2 \\ 0 & 2 & 15 & -9 \end{array} \right] \]

Replace row 3 with the sum of row 3 and negative 2 times row 2:

\[\left[ \begin{array}{rrrr} 1 & 0 & -3 & 8 \\ 0 & 1 & 5 & -2 \\ 0 & 0 & 5 & -5 \end{array} \right] \]

Scale row 3 by 1/5:

\[\left[\begin{array}{rrrr} 1 & 0 & -3 & 8 \\ 0 & 1 & 5 & -2 \\ 0 & 0 & 1 & -1 \end{array} \right] \]

Replace row 2 with the sum of row 2 and negative 5 times row 3:

\[\left[\begin{array}{rrrr} 1 & 0 & -3 & 8 \\ 0 & 1 & 0 & 3 \\ 0 & 0 & 1 & -1 \end{array} \right] \]

Replace row 1 with the sum of row 1 and three times row 3:

\[\left[\begin{array}{rrrr} 1 & 0 & 0 & 5 \\ 0 & 1 & 0 & 3 \\ 0 & 0 & 1 & -1 \end{array} \right] \]

This final matrix is equivalent to the following system of equations:

\[\begin{aligned} x_1 &= 5 \\ x_2 &= 3 \\ x_3 &= -1 \end{aligned} \]

Thus the solution set is \((5,3,-1)\)

The example above is how I would typically ask or answer a question posted on a bulletin board. Actually, giving out the entire solution (as above) is typically frowned upon and most people just give enough hints so that the person who asked the question can figure it out on their own. However, you can definitely see from the example that LaTeX allows you to cleanly print the matrices, which makes it much easier to understand. I remember back in high school when my friends and I would struggle trying to help each other out via AIM or some other chat client. I only wish I’d found out about LaTeX sooner.

Posted in: Logs, Mathematics / Tagged: LaTeX, mathoverflow, matrices, matrix, row operations, stackoverflow

No 87: Books I’ve Been Reading Lately

13 June, 2013 9:29 PM / 1 Comment / Gene Dan

I’ve been reading some books:

1984 and Starship Troopers

I don’t have a lot of time to read fiction due to work and study, so I started listening to audiobooks during my commute, and whenever I’m driving, in general. I’ve discovered that can get through books surprisingly quickly this way – 1984 and Starship Troopers took me roughly 2 weeks each to finish, both of which are about 300 pages long in print. I started first with Starship Troopers since the title was recognizable – I had seen the film adaptation first, but I found the book much more enjoyable – the movie was mostly an action-packed bloodbath whereas the book focused more on Juan Rico’s development as a soldier living under an authoritarian regime; training as a recruit and then as an officer. In this sense, the plots were almost completely different, and in my opinion the film really butchered the book. For example, the main character’s nationality was Filipino, which was actually an important point as the book was written during a particularly sensitive time with respect to race in the United States. This aspect was completely absent in the film adaptation.

I picked up 1984 so I could understand all the cultural references that I’ve seen in the media. It read like an adult version of Animal Farm, and touched upon many of the same subjects with respect to totalitarianism and the Communist revolution. It even had two characters representing Stalin (Big Brother) and Trotsky (Goldstein), just like animal farm did (Napoleon and Snowball, respectively). I thought the plot was okay, but it was really the ideas on state censorship, surveillance, and historical revisionism that stuck me as important, and these ideas were probably what made the book so culturally important. It was also one of the most quotable books I’ve ever read. I recognized some references that I already knew came from the book, but also some new ones that I didn’t realize were inspired by 1984:

  • Big Brother is watching you
  • We have always been at war with Eastasia
  • Hate Week
  • The chocolate rations have been reduced
  • Room 101
  • Newspeak, Doublethink
  • Thoughtcrime
  • Thought Police

There were a lot more, but that’s what I could think of off the top of my head. After 1984, I started reading Asimov’s Foundation, which I thought contained some pretty neat ideas on what society would be like in an age where humans have mastered interstellar travel. The book is mostly dialogue, which I found dry after the first few chapters. I’m currently reading this right now although I find that I have to switch between listening to the radio and the audiobook due to the lack of plot.

Modern Database Management
I’m reading Modern Database Management to get a better understanding of database design and structure. Several people have asked me why I’ve spent the time to do so and I’ve responded that it’s to better understand how data are stored in an organization, as well as how IT departments are structured so as to facilitate communication between myself and my coworkers in IT. I also think that learning how to write queries efficiently and effectively in SQL will increase my productivity and facility when it comes to manipulating data. This is often the most time-consuming task when it comes to performing statistical analyses, so I think these gains will be well worth the investment (about 200 hours or so).

Data Mining: Practical Machine Learning Tools and Techniques

I’ve decided to spend a little bit of time each day (30 minutes or so), reading advanced technical material that is beyond reach of my current level of proficiency. This is not so much for understanding but moreso for exposure to new subjects that I might want to study in the near future. I picked up Data Mining because it’s been heavily touted by the media as “the next big thing,” so I wanted to see what it was all about (although we must approach such claims with caution). I actually use some of these techniques at work – such as building regression models and using cross validation. The book is surprisingly accessible, and not very technical. I actually found the first few chapters accessible and enjoyable, and didn’t struggle like I thought I would. It mostly covers the purpose, motivations, and importance of data mining techniques and points the reader to external material should they want to explore the topic further. In my opinion it’s actually important to have a non-technical text on the subject, as many data mining tools are implemented via different computer languages and software packages – for example, it might not benefit the reader (or at least it would inconvenience him) if the book focused on the nuts and bolts of one computer language whereas his employer used another.

For this type of reading I’m not aiming at 100% understanding, I’m mostly reading these to see where I should go next, and to gain familiarity with the vocabulary and terminology used in certain subject areas. Should I ever decide to look into a subject more deeply, I’ll come back to a text for a second reading once I master the subject’s prerequisites.

Posted in: Logs / Tagged: 1984, data mining, modern database management, starship troopers

Post Navigation

« Previous 1 … 11 12 13 14 15 … 30 Next »

Archives

  • September 2023
  • February 2023
  • January 2023
  • October 2022
  • March 2022
  • February 2022
  • December 2021
  • July 2020
  • June 2020
  • May 2020
  • May 2019
  • April 2019
  • November 2018
  • September 2018
  • August 2018
  • December 2017
  • July 2017
  • March 2017
  • November 2016
  • December 2014
  • November 2014
  • October 2014
  • August 2014
  • July 2014
  • June 2014
  • February 2014
  • December 2013
  • October 2013
  • August 2013
  • July 2013
  • June 2013
  • March 2013
  • January 2013
  • November 2012
  • October 2012
  • September 2012
  • August 2012
  • July 2012
  • June 2012
  • May 2012
  • April 2012
  • March 2012
  • February 2012
  • January 2012
  • December 2011
  • September 2011
  • August 2011
  • July 2011
  • June 2011
  • January 2011
  • December 2010
  • October 2010
  • September 2010
  • August 2010
  • June 2010
  • May 2010
  • April 2010
  • March 2010
  • September 2009
  • August 2009
  • May 2009
  • December 2008

Categories

  • Actuarial
  • Cycling
  • Logs
  • Mathematics
  • MIES
  • Music
  • Uncategorized

Links

Cyclingnews
Jason Lee
Knitted Together
Megan Turley
Shama Cycles
Shama Cycles Blog
South Central Collegiate Cycling Conference
Texas Bicycle Racing Association
Texbiker.net
Tiffany Chan
USA Cycling
VeloNews

Texas Cycling

Cameron Lindsay
Jacob Dodson
Ken Day
Texas Cycling
Texas Cycling Blog
Whitney Schultz
© Copyright 2025 - Gene Dan's Blog
Infinity Theme by DesignCoral / WordPress