This entry is part of a series dedicated to MIES – a miniature insurance economic simulator. The source code for the project is available on GitHub.
Current Status
Last week, I specified a Cobb Douglas utility curve for each person in MIES. I also demonstrated a situation in which a person might choose to not fully insure. However, I’ve gone a few chapters ahead in my readings and found out that under certain assumptions, a risk-averse person who is offered a fair premium will choose to fully insure. In MIES, since each company charges the pure premium without loading for profit or expenses, each person is getting a fair premium – so there’s something missing from my current model that makes it inconsistent with economic theory.
Risk aversion is not yet implemented in MIES, and will have to wait a few weeks before I get to it, since there’s quite a bit of work to do. But I’m mentioning the issue here, just in case someone reading this knows more about the subject than I do.
This week, I’m going to demonstrate a set of tools to examine consumer choice – the offer, Engel, and personal demand curves. I don’t recall using the first two curves very much in my economics courses, but the latter will be very important and will serve as a bridge between personal demand and market demand. Surprisingly, these curves were very quick to implement, since they all rely on the same method I wrote last week for the Cobb Douglas class.
The topic of this post roughly corresponds to chapter 6 of Varian.
Offer Curve
The offer curve for a consumer depicts their optimal consumption bundle at each level of income. Since the offer curve is unique to a particular consumer, I decided to define the methods that generate and plot the offer curve within the Person class. Luckily, the CobbDouglas class that I defined last week has a method called optimal_bundle, which returns the optimal consumption bundle given a set of prices and income. Since this is exactly what we need given the definition of the offer curve, we can simply use this method to generate each person’s offer curve:
|
1 2 3 4 5 6 7 8 9 10 |
def get_offer(self): # only works for Cobb Douglas right now def o(m): return self.utility.optimal_bundle( p1=self.premium, p2=1, m=m ) self.offer = o |
Note that while I only have one utility curve defined in MIES at the moment (Cobb Douglas), the definition of the offer curve doesn’t need to have anything specific to the Cobb Douglas utility function. This means in the future, I should be able to abstract this method to accept other utility functions without too much modification.
I’ve also added a method to plot a person’s offer curve:
|
1 2 3 4 5 6 7 8 9 10 11 12 13 14 15 |
def show_offer(self): offer_frame = pd.DataFrame(columns=['income']) offer_frame['income'] = np.arange(0, self.income * 2, 1000) offer_frame['x1'], offer_frame['x2'] = self.offer(offer_frame['income'])[:2] offer_trace = { 'x': offer_frame['x1'], 'y': offer_frame['x2'], 'mode': 'lines', 'name': 'Offer Curve' } fig = self.consumption_figure fig.add_trace(offer_trace) plot(fig) |
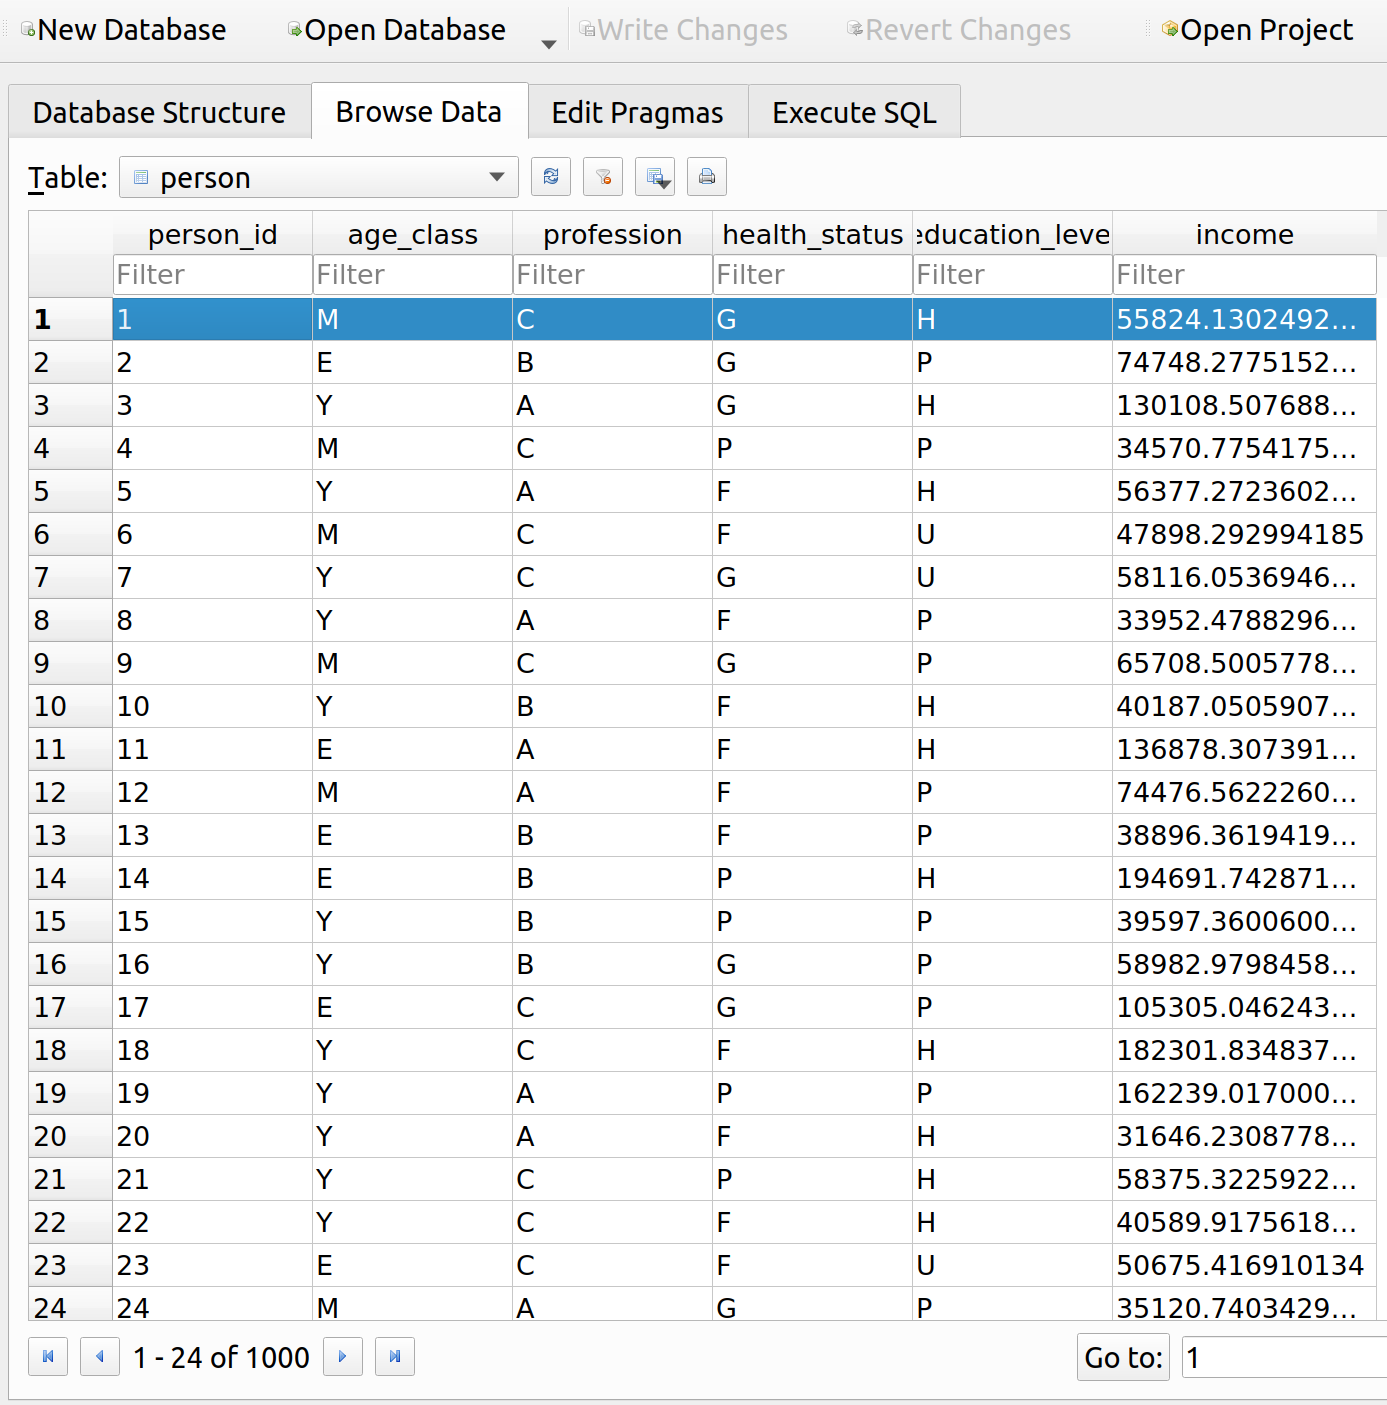
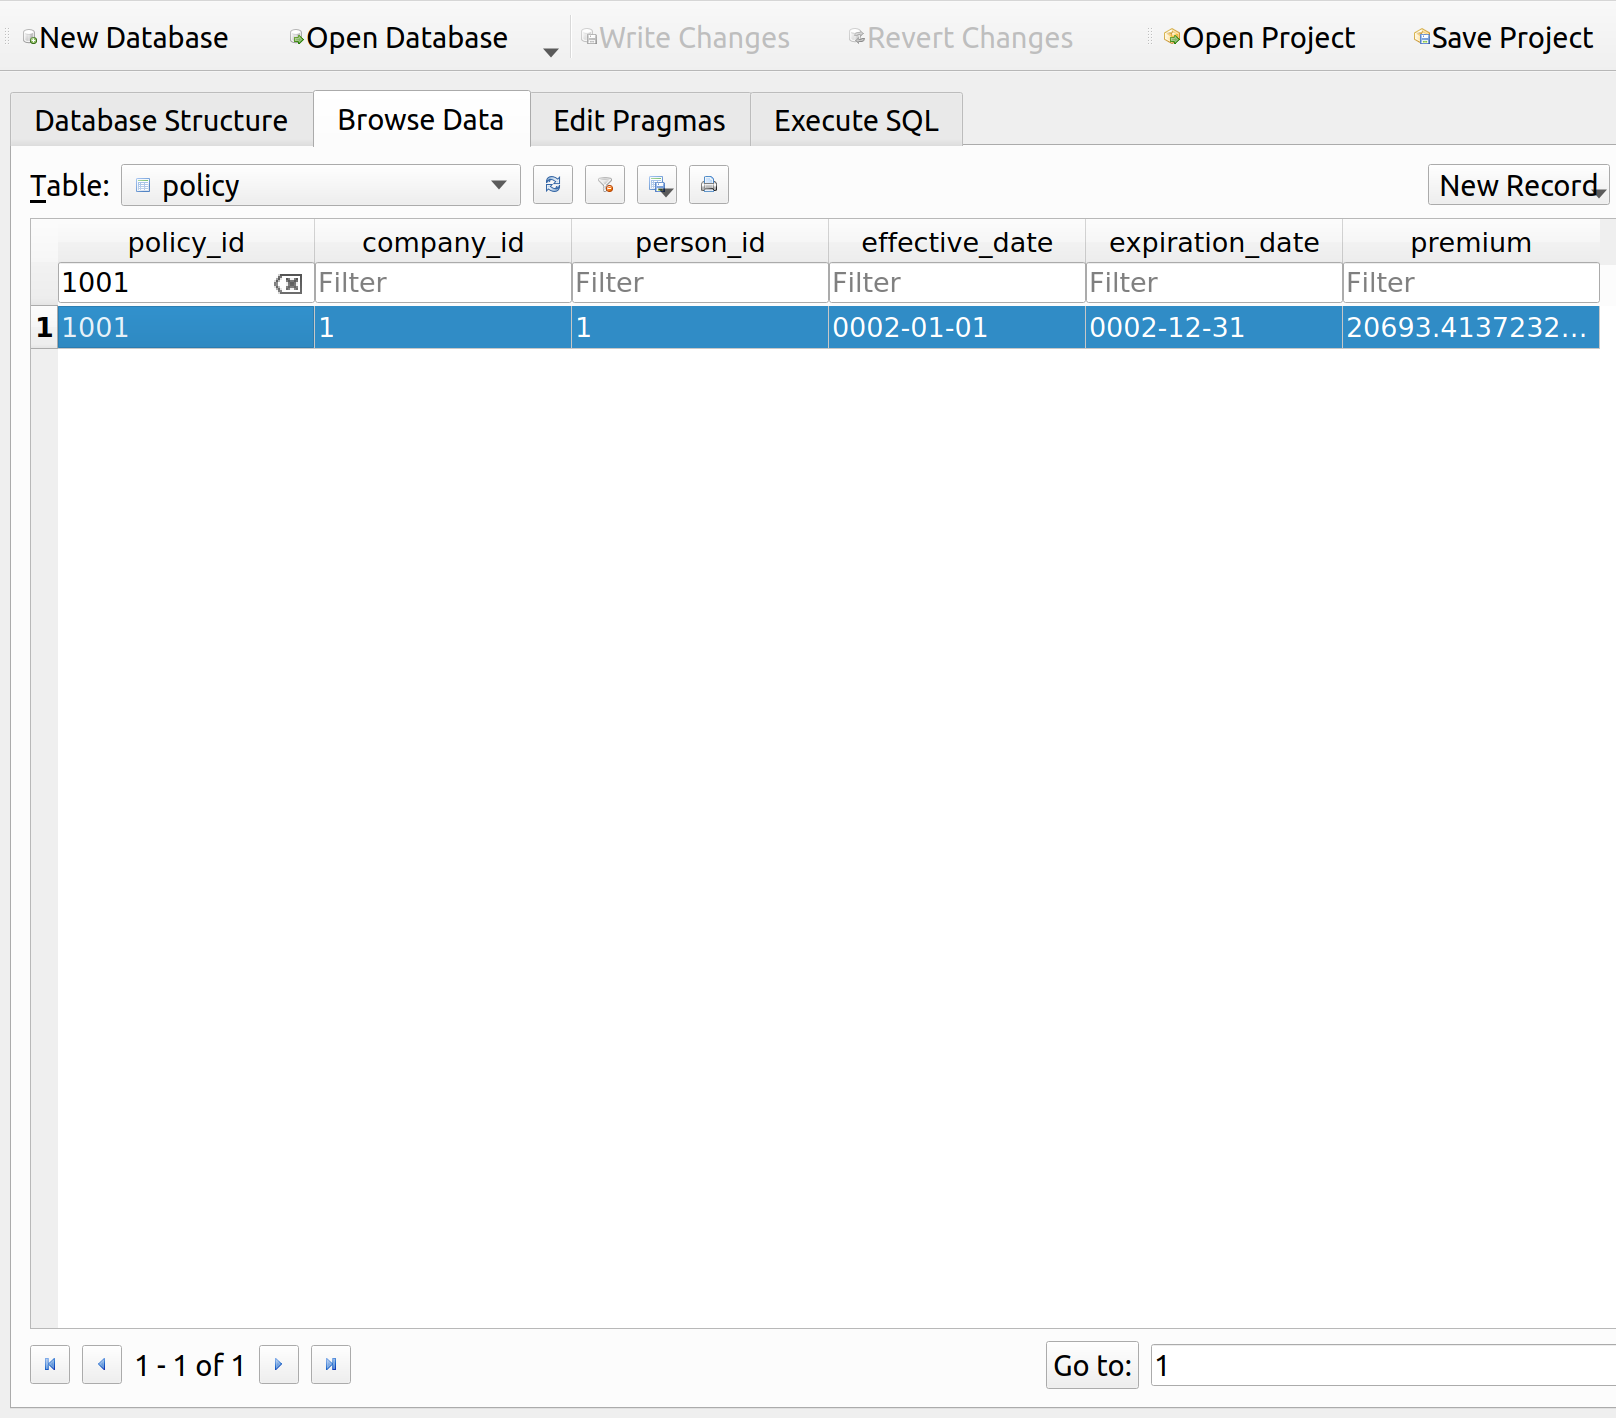
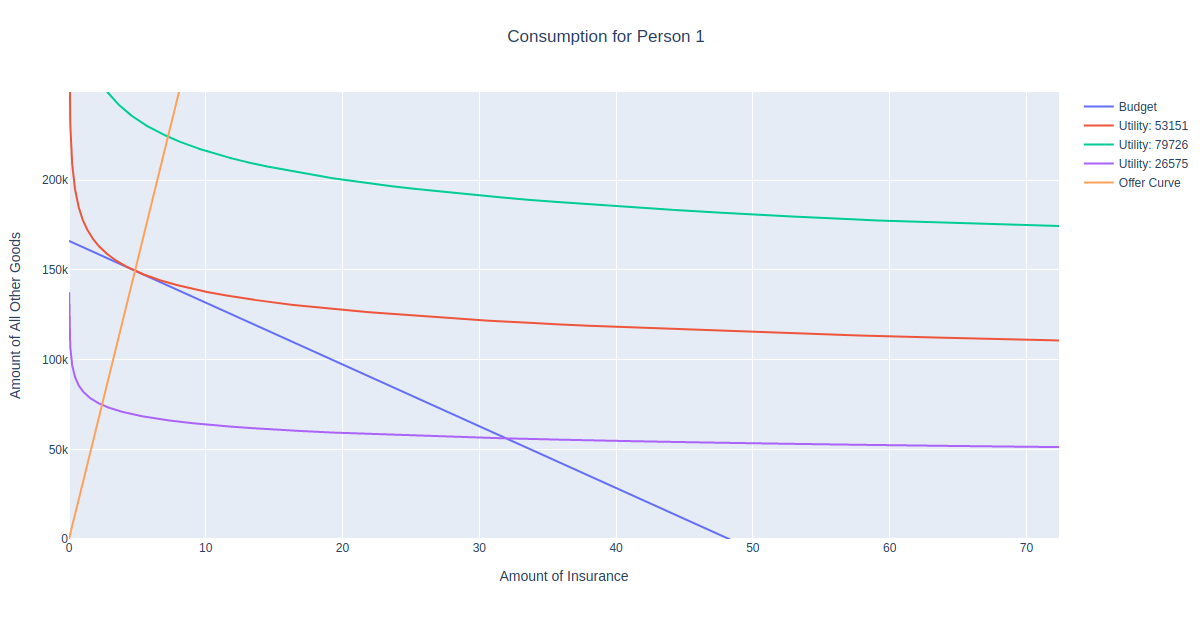
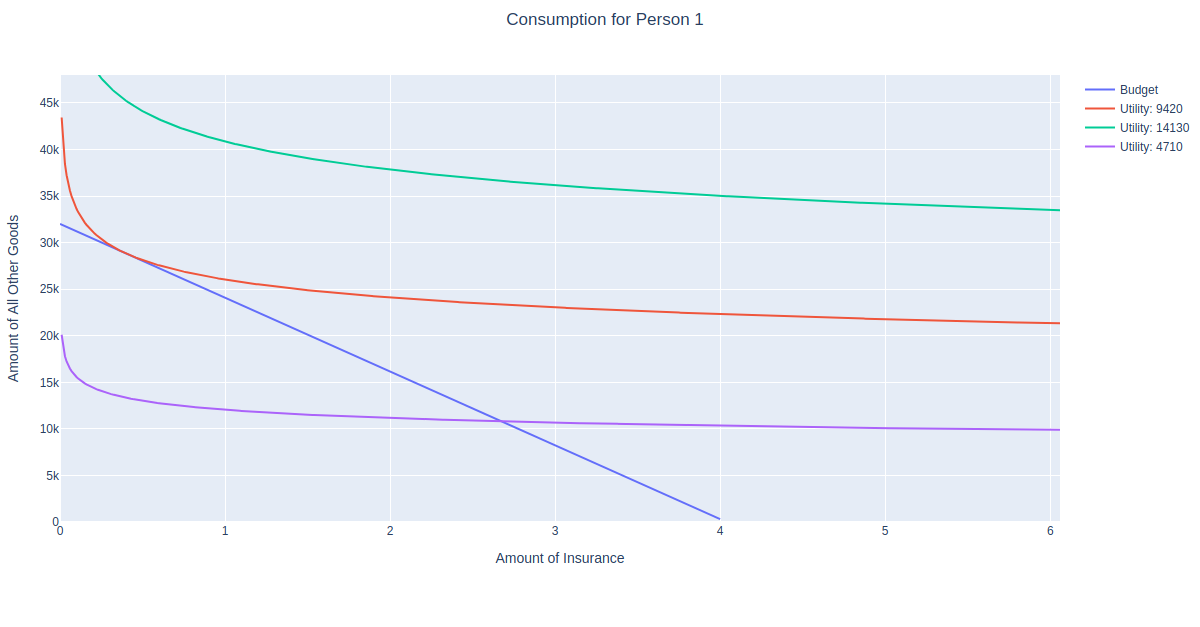
This method takes a preset range of income values, and uses the get_offer method to plot the optimal consumption bundle for each income value in the range. For example if we’ve already run a few iterations of a market simulation, we can examine what combinations of insurance and non-insurance a person can afford at different income levels. Let’s do this for the person with id=1:
|
1 2 3 4 5 6 7 8 |
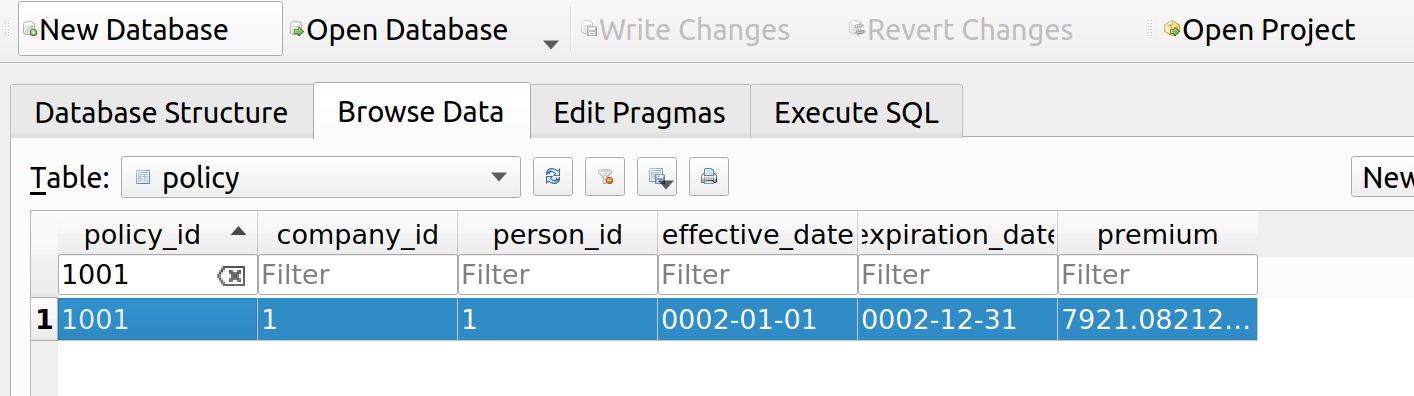
my_person = Person(session=gsession, engine=engine, person=PersonTable, person_id=1) my_person.get_policy(Policy, 1001) my_person.get_budget() my_person.get_consumption() my_person.get_consumption_figure() my_person.get_offer() my_person.show_offer() |
Imagine what would happen if you were to shift the blue budget line inward and outward. The optimal consumption bundle would the the point of tangency with the corresponding utility function. We can see that the orange offer curve is the set of all these points.
Engel Curve
The Engel curve is similar to the offer curve, but plots the optimal choice of a good at various levels of income. Its definition within the Person class is also similar, except we only need to return the first good of the optimal bundle:
|
1 2 3 4 5 6 7 8 9 10 11 |
def get_engel(self): # only works for Cobb Douglas right now def e(m): return self.utility.optimal_bundle( p1=self.premium, p2=1, m=m )[0] self.engel = e |
|
1 2 3 4 5 6 7 8 9 10 11 12 13 14 15 16 17 18 19 20 21 22 23 24 25 26 27 |
def show_engel(self): engel_frame = pd.DataFrame(columns=['income']) engel_frame['income'] = np.arange(0, self.income * 2, 1000) engel_frame['x1'] = engel_frame['income'].apply(self.engel) engel_trace = { 'x': engel_frame['x1'], 'y': engel_frame['income'], 'mode': 'lines', 'name': 'Engel Curve' } fig = go.Figure() fig.add_trace(engel_trace) fig['layout'].update({ 'title': 'Engel Curve for Person ' + str(self.id), 'title_x': 0.5, 'xaxis': { 'title': 'Amount of Insurance' }, 'yaxis': { 'title': 'Income' } }) plot(fig) |
Let’s see what the Engel curve looks like for person 1:
|
1 2 3 4 5 6 7 8 9 |
my_person = Person(session=gsession, engine=engine, person=PersonTable, person_id=1) my_person.get_policy(Policy, 1001) my_person.premium my_person.get_budget() my_person.get_consumption() my_person.get_consumption_figure() my_person.get_engel() my_person.show_engel() |
Demand Curve
The demand function depicts how much of a good a person would buy if it were at a certain price. This one’s important since we’ll need it to derive industry demand, which will then be used to answer many fundamental questions about the insurance market. Like the other curves, defining this one was simple, we just get the optimal bundle at each price and return the quantity demanded of the first good:
|
1 2 3 4 5 6 7 8 9 10 11 |
def get_demand(self): # only works for Cobb Douglas right now def d(p): return self.utility.optimal_bundle( p1=p, p2=1, m=self.income )[0] self.demand = d |
|
1 2 3 4 5 6 7 8 9 10 11 12 13 14 15 16 17 18 19 20 21 22 23 24 25 26 27 28 |
def show_demand(self): demand_frame = pd.DataFrame(columns=['price']) demand_frame['price'] = np.arange(self.premium/100, self.premium * 2, self.premium/100) demand_frame['x1'] = demand_frame['price'].apply(self.demand) demand_trace = { 'x': demand_frame['x1'], 'y': demand_frame['price'], 'mode': 'lines', 'name': 'Demand Curve' } fig = go.Figure() fig.add_trace(demand_trace) fig['layout'].update({ 'title': 'Demand Curve for Person ' + str(self.id), 'title_x': 0.5, 'xaxis': { 'range': [0, self.income / self.premium * 2], 'title': 'Amount of Insurance' }, 'yaxis': { 'title': 'Premium' } }) plot(fig) |
Let’s see what the demand curve looks like for person 1:
|
1 2 3 4 5 6 7 8 9 10 |
my_person = Person(session=gsession, engine=engine, person=PersonTable, person_id=1) my_person.get_policy(Policy, 1001) my_person.premium my_person.get_budget() my_person.get_consumption() my_person.get_consumption_figure() my_person.get_offer() my_person.get_demand() my_person.show_demand() |
Note that the demand curve slopes downward as it should, since we’d expect a person to buy more insurance the cheaper it is. However, note that there is no price such that the demand equals zero. The demand curve asymptotically approaches zero as the premium increases, but this particular person will never go uninsured. This is due the property of the Cobb Douglas utility function that the exponent of the good equals the percent of income spent on that good, which is hard coded as 10% at the moment. However, in the real world people do go uninsured, and this is a subject of great interest to me, so we’ll need to revisit this later.
Further Improvements
I’ve added quite a few features to the person class, but I haven’t integrated them to the point where I can perform more than two market simulations. I’m also several chapters ahead in my readings than what I’ve posted about, and I’ve encountered an interesting demonstration on risk aversion and intertemporal choice concerning assets, which will take quite an effort to both implement and reconcile with what I’ve written so far.
![\[u(x_1, x_2) = x_1^c x_2^d\]](https://genedan.com/wp-content/ql-cache/quicklatex.com-0763177252d9d93761628dd46690e8ad_l3.png "Rendered by QuickLaTeX.com")
 and
and  when
when  , and each x represents the quantity of each good. While other utility functions may eventually prove to be more realistic for our simulation, Cobb-Douglas utility functions are a good candidate to start with since they have many convenient features. For example, in order to find the optimal consumption bundle for a person, we need to find the bundle of goods such that the marginal rate of substitution (MRS) equals the slope of the budget constraint, while satisfying the budget constraint itself. For the Cobb-Douglas utility function, Varian provides a derivation for the MRS:
![\[\text{MRS} = -\frac{\partial u(x_1, x_2) / \partial x_1}{\partial u(x_1, x_2) / \partial x_2} \]](https://genedan.com/wp-content/ql-cache/quicklatex.com-93ba278bee63e3fe4c8cc2e29667856a_l3.png "Rendered by QuickLaTeX.com")
 , to solve for the quantities of
 ![\[x_1 = \frac{c}{c + d}\frac{m}{p_1}\]](https://genedan.com/wp-content/ql-cache/quicklatex.com-4e7c26475288b93f38e711ba6d172711_l3.png "Rendered by QuickLaTeX.com")
![\[x_2 = \frac{d}{c + d} \frac{m}{p_2}\]](https://genedan.com/wp-content/ql-cache/quicklatex.com-5181aa65fa32205703b8f7d0516ce4ca_l3.png "Rendered by QuickLaTeX.com")
 and
and  . This means that using this result, we can find the optimal consumption bundle algebraically. This is very useful since 1) I have simply forgotten a lot of calculus since leaving school and 2) I won’t have to program calculus into MIES for the time being.
 and
and  parameters in the function definition. The class provides three methods: optimal_bundle() calculates the optimal consumption bundle using the results derived by Varian, trace() defines the curve as it will appear when plotted, and show_plot() plots the utility function.
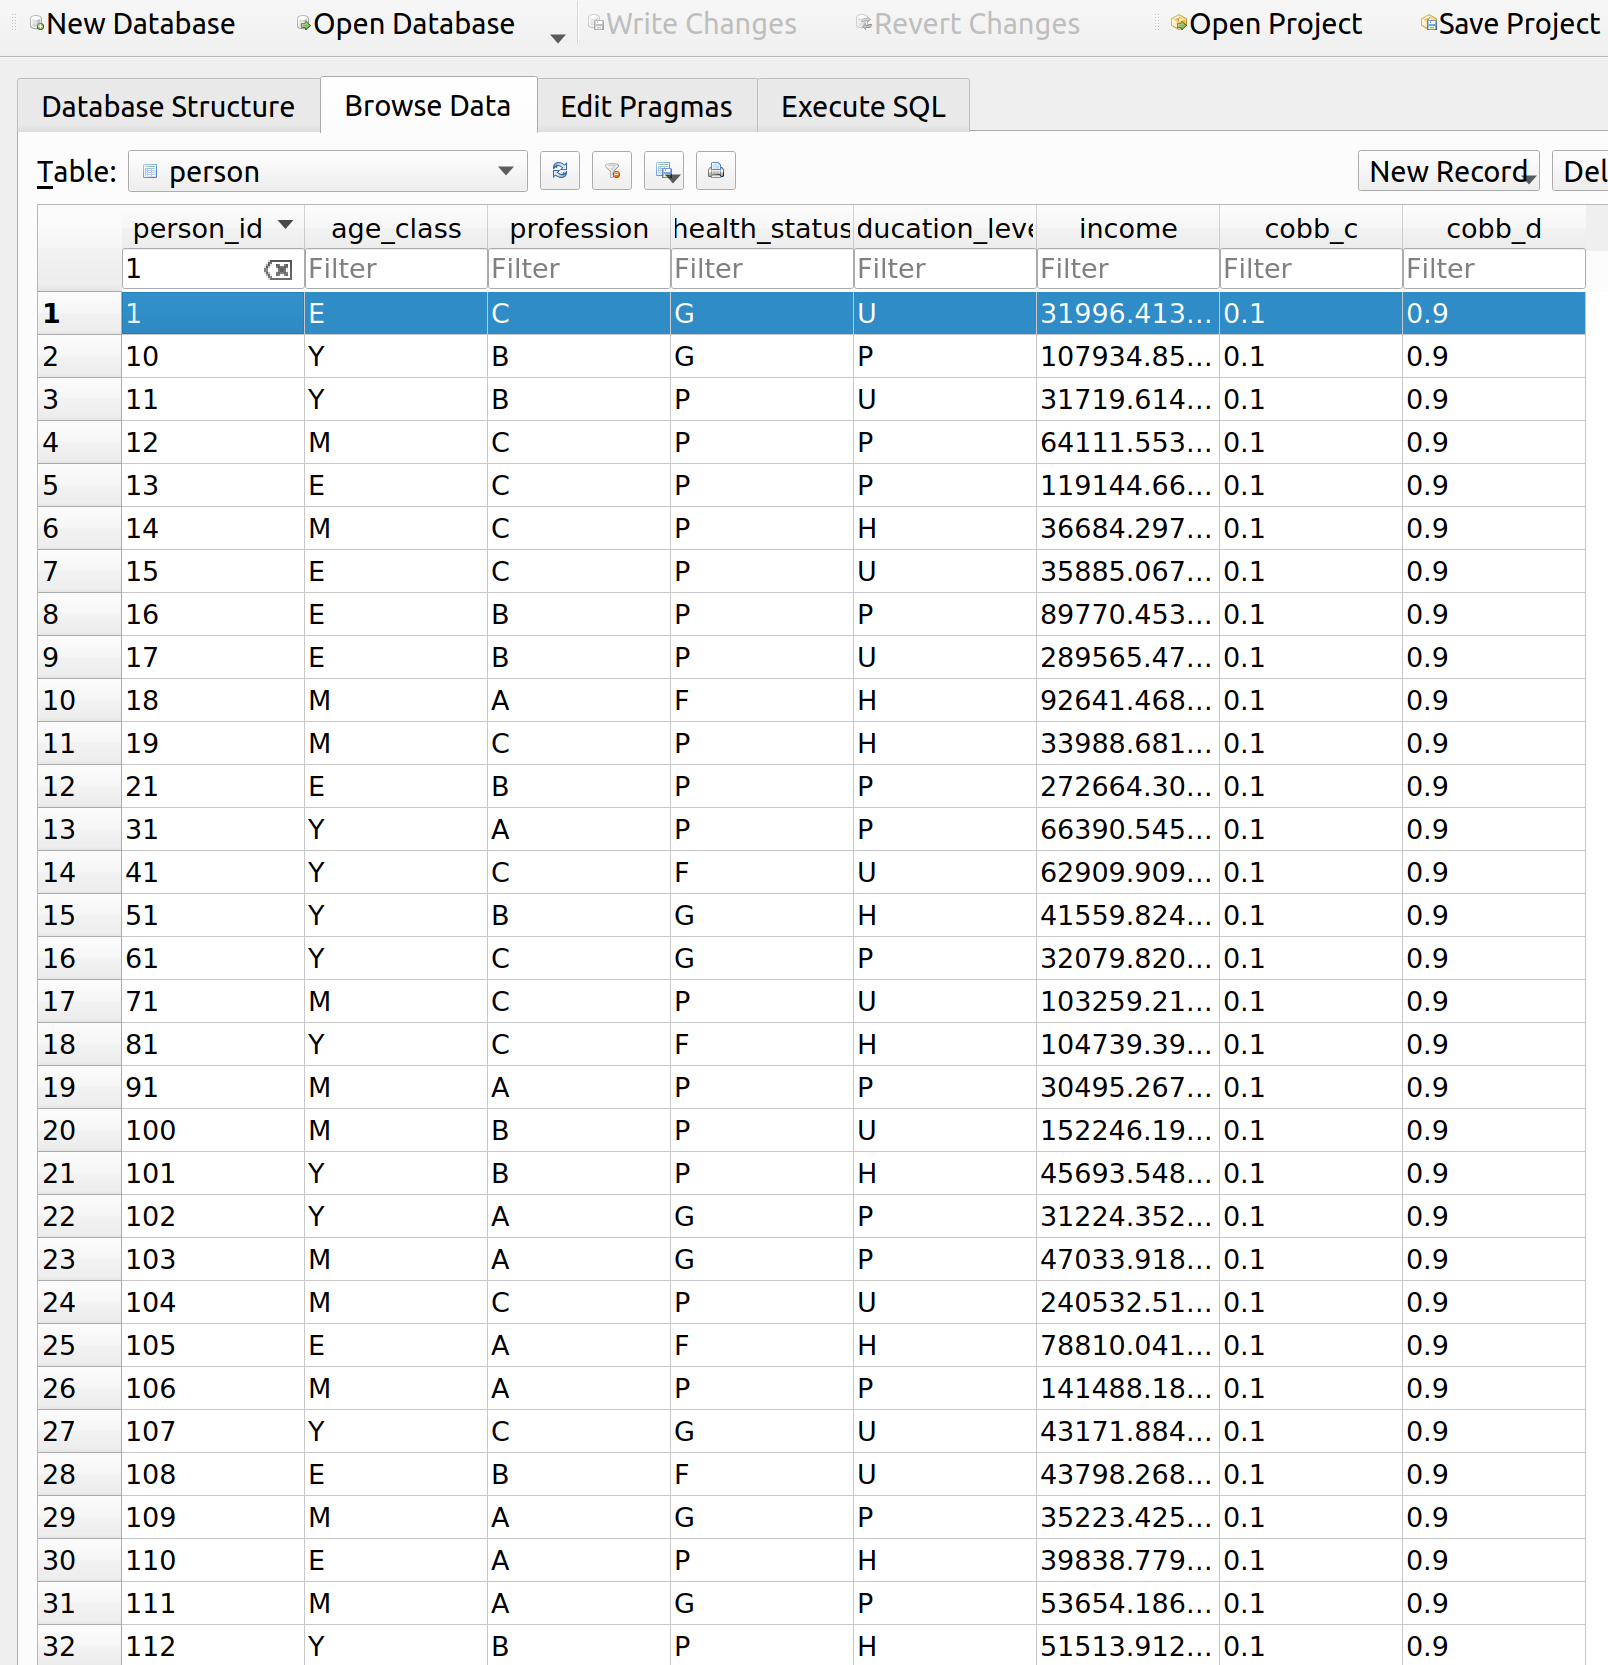
 , the same as that derived in Varian. That looks pretty useful. However, Sympy’s documentation is massive, at over 2000 pages. It might take some time to learn it, even if it just involves me grabbing what I need. Since I can make do without calculus for the time being, I’ll save this for another day.
![\[p_1 x_1 + p_2 x_2 = m\]](https://genedan.com/wp-content/ql-cache/quicklatex.com-68e17c847ae7dad05f2f79a83362572e_l3.png "Rendered by QuickLaTeX.com")