• Home
  • Readings
  • Github
  • MIES
  • TmVal
  • About
Gene Dan's Blog

Category Archives: Logs

No. 104: 70 Days of Linear Algebra (Day 2)

5 June, 2014 7:39 AM / Leave a Comment / Gene Dan

Section: 1.2 – Row Reduction and Echelon Forms
Status: On target

Today I’ll demonstrate a couple of algorithms performed on a 3×4 matrix (we’ll call it A) performed in SAGE. SAGE is an open source computer algebra system intended as an alternative to proprietary systems such as Mathematica, MATLAB, etc. I’ve written about SAGE a few times, here, here and here. To begin, we’ll define A as follows:

\[A=\left[\begin{array}{rrrr} 1 & -2 & 1 & 0 \\ 0 & 2 & -8 & 8 \\ -4 & 5 & 9 & -9 \end{array} \right] \]

To define this matrix in SAGE (actually I think a more modern name would just be “sage”), we can open up the Linux terminal and use Python commands to assign the matrix object to the variable A:

ubuntu@ubuntu-desktop: ~-sage-6.2-x86_64-Linux_226

Those who are familiar with the Python programming language will know that the dir() function returns a list of methods that can act upon an object. Methods are functions that are defined within classes that can act upon instances of those classes. Here, we can use dir() to determine what methods are available to us through sage:ubuntu@ubuntu-desktop: ~-sage-6.2-x86_64-Linux_227

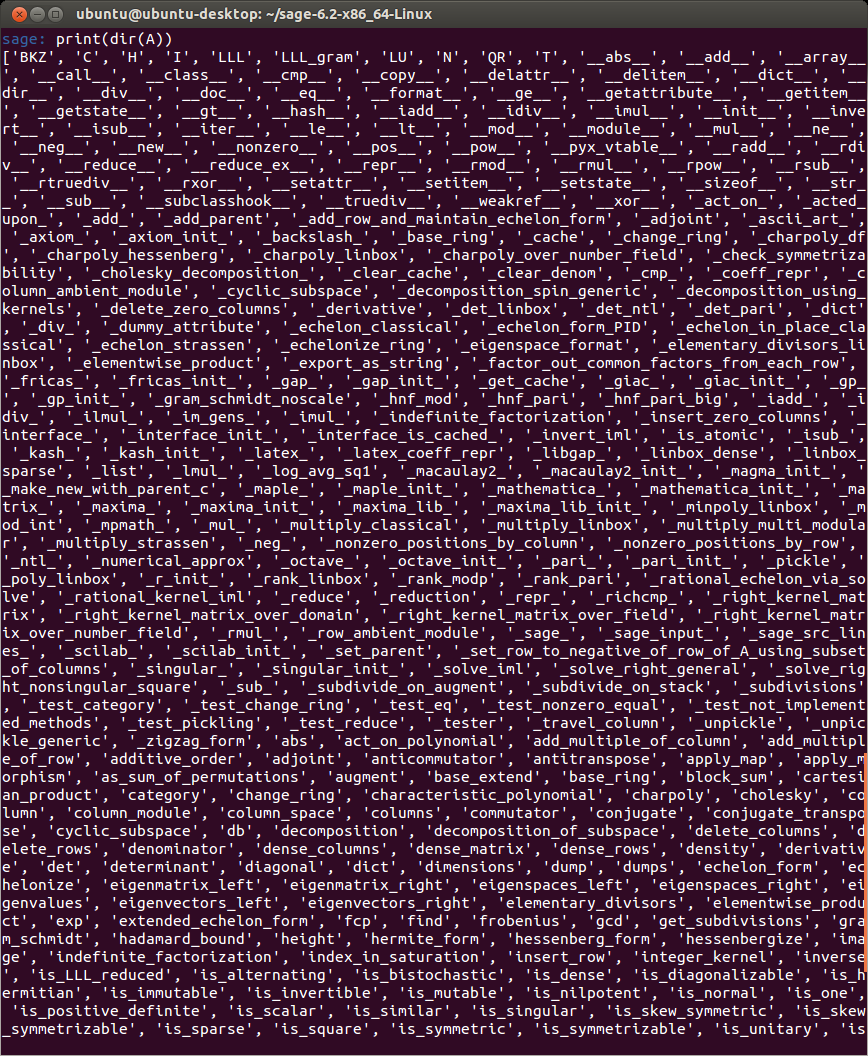
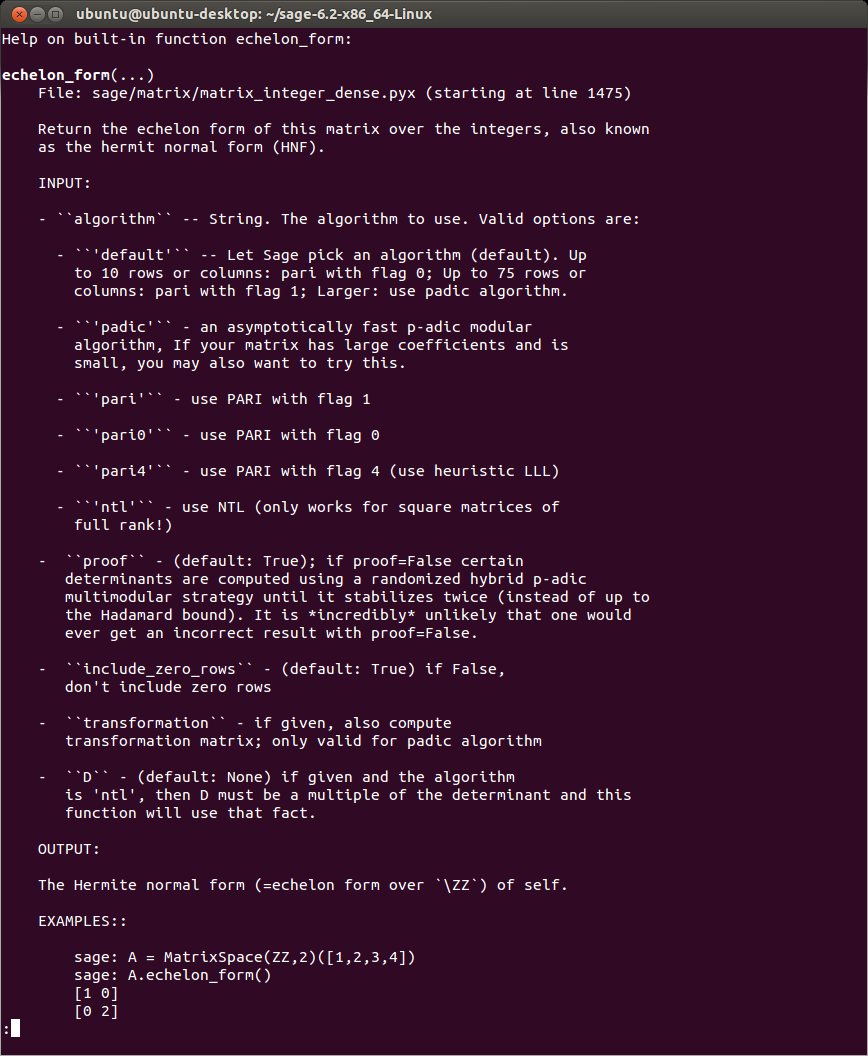
For new users, the variety of methods can be bewildering and somewhat intimidating – but if you look closely you’ll find a method called ‘echelon_form’, which is exactly what we’d guess – a function that returns the row echelon form of our matrix A. Before proceeding, we can type help(A.echelon_form) which confirms that the method does indeed perform the algorithm that most students learn within the first week of their Linear Algebra course (except much faster!):

ubuntu@ubuntu-desktop: ~-sage-6.2-x86_64-Linux_228

Now, typing in A.echelon_form() returns the echelon form of A. The method rref stands for reduced row echelon form, which produces the solution to A’s equivalent linear system:

ubuntu@ubuntu-desktop: ~-sage-6.2-x86_64-Linux_229

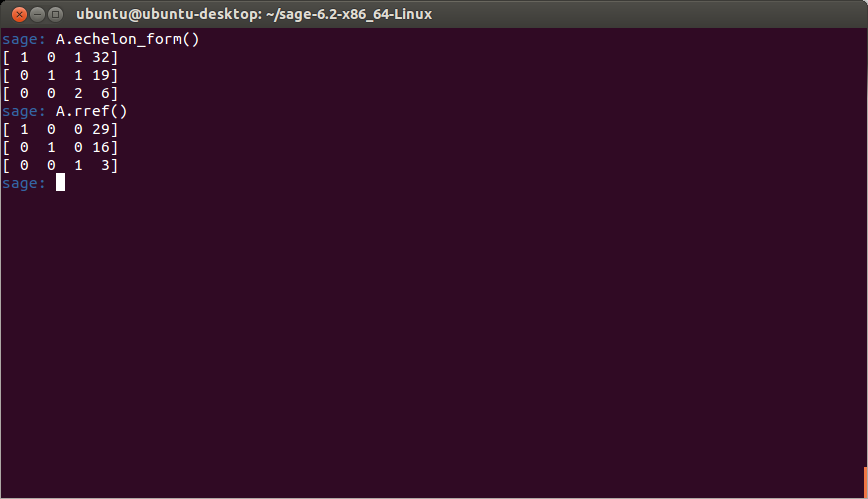
As you can see, the solution is the point (29, 16, 3).

Posted in: Logs, Mathematics

No. 102: There Will Never be a Perfect Time for Something

17 February, 2014 9:53 PM / Leave a Comment / Gene Dan

I’ve had a hectic last couple months – holiday traveling, family get-togethers, end-of-year projects at work, and so on, and so forth. Despite this, I think I’ve made some big strides in learning the technical skills needed for my upcoming computer projects. In the closing months of 2013, I learned Python. I learned git. I read a 400-page book on how to use the Linux command line. However, every time I felt like I was confident enough to start on a project, I would soon stumble across the latest thing on Hacker News and would have to learn it because it’s the hottest language in the field and every developer will be using it soon.

Haskell you say? Okay, I’ll put in an order for another 350-page book on Amazon. Yes, Haskell, but you need an IDE to edit your code. Alright, that 500-page book on vi and Vim goes into my shopping cart. Okay, no need to worry. It’ll take a while to learn, but this will be the text editor to end all text editors. Then I’ll finally get started on something. But what about Emacs, not everyone uses Vim, maybe you need to learn it to get a better perspective on things. So then another 500-page book goes in the cart. Then I need to learn how to parse text files so yet another book on regular expressions gets added to the cart, then a book on sed, another on grep, and so on, and so forth…

$400 later and enough new books to occupy myself for another 2 years – and I still haven’t gotten past the brainstorming phase on my latest project (to be specific I’m working on some software that will simulate economic markets – but that is a subject for another post). Part of this is a symptom of me not starting programming 10 years ago, but another part of it is that I keep waiting to have the perfect skillset just to start a project. I’ll have to come to grips with myself that my desired state of programming nirvana will never happen.

Every product that reaches the market, and every technology that is developed, will never be perfect. I’m not talking about fatal design flaws that lead to product failure, but imperfection in the sense that human wants and needs will continue to evolve, and under these circumstances, existing products will need to be improved or redesigned to meet the needs of the future. On the other hand, as a designer, you want to be able to anticipate anything that can go wrong with a product. However, the fear of failure can be crippling and in the end, you never get anything done as a result. But it’s not really until you get your product into the hands of other people that you really get to see where improvements can be made, and such feedback is vital to the designer. The key is that you need to make your creation improve the human condition in some way, even if it’s not perfect. As your product, and the ideas and innovations that come along with it – are circulated throughout the population, only then does it allow other people build upon what you’ve done and to create new ideas of their own. Then, life marches on. But if your ideas never get executed, nothing happens, and humanity leaves you behind.


– P.S. –

You may have noticed that I added a github link to the top of the page. There’s not much on it currently, but I did create and give a presentation on dynamic documents at the Houston Visualization Meetup two weeks ago. You can view the presentation materials here. In the meantime, I will be updating the repositories daily.

Posted in: Logs / Tagged: databases, economics, github, RDBMS, relational databases, simulation

No. 100: Strike Incidents – Visualizing Data with ggplot2

17 October, 2013 7:55 PM / Leave a Comment / Gene Dan

Today, I’d like to demonstrate some of ggplot2‘s plotting capabilities. ggplot2 is a package for R written by Hadley Wickham, who teaches nearby at Rice University. I’ve been using it as my primary tool for visualizing data both at work and in my spare time.

Wildlife Strikes

The Federal Aviation Administration oversees regulations concerning domestic aircraft. One of the interesting things they keep track of are collisions between aircraft and wildlife – the vast majority of which involving birds. This dataset is available for download from the FAA website.

It turns out that bird strikes happen a lot more frequently than I thought. A quick look at the database revealed that 146,607 reported incidents have occured since 1990 (about 11,000 per year), with the number of birds killed ranging anywhere from 1 to over 100 per incident (cases in which an airplane flew through a flock of birds). Although human deaths are infrequent (less than 10 per year), bird strikes cause substantial physical damage at around $400 million per year

ku-bigpic

An example of bird-related damage.

Data Preparation
There are tools available that allow R to communicate with databases via ODBC connectivity. The database concerning strike incidents is in .mdb format which can be accessed with the package RODBC.

The code below loads the package RODBC along with ggplot2 and returns a brief summary of our dataset:

1
2
3
4
library(RODBC)
library(ggplot2)
 
channel

str

As you can see, data in this form are not easy to interpret. R’s visualization tools allow us to transform this data into something meaningful for our audience.

RODBC lets us send SQL queries to the database connection to aggregate and summarize the data. I found MSAccess’ particular SQL implementation to be very awkward, but I was able to alter my code enough to succesfully return the number of incidents by year:

1
2
3
4
5
6
7
8
strikes.yr <- sqlQuery(channel,"SELECT [INCIDENT_YEAR] AS [Year],
                                      COUNT(*) AS [Count]
                                      FROM [StrikeReport]
                                      GROUP BY [INCIDENT_YEAR]
                                      ORDER BY [INCIDENT_YEAR]")
 
strikes.yr <- aggregate(Count~Year,FUN=sum,data=strikes)
strikes.yr

stryr

Next, we use the function ggplot from ggplot2 to create a bar plot of our data:

1
2
3
4
ggplot(strikes.yr,aes(x=Year,y=Count))+
  geom_bar(stat="identity",fill="lightblue",colour="black")+
  theme(axis.text.x = element_text(angle=60, hjust=1,size=rel(1)))+
  ggtitle("Strike Incidents by Year")+theme(plot.title=element_text(size=rel(1.5),vjust=.9))

strike_yr

From the diagram above, we can see that the number of strikes has increased substantially over the last 24 years. However, we can’t make any definite conclusions without more information. Perhaps this increase is due to more aircraft being flown for longer durations. Or maybe it’s due to better/more accurate reporting of incidents. Notice that the bar for 2013 is much lower than the previous year. The most straightforward explanation for this observation is that 2013 isn’t over yet, and not all the incidents that have happened have been reported yet.

We can use ggplot2 to see the proportion of strikes that have been incurred by the military. The fill argument specifies that the bars should be segmented by operator type:

1
2
3
4
5
ggplot(strikes,aes(x=Year,y=Count,fill=OperatorType))+
  geom_bar(stat="identity",colour="black")+
  scale_fill_brewer(palette="Pastel1")+
  theme(axis.text.x = element_text(angle=60, hjust=1,size=rel(1)))+
  ggtitle("Strike Incidents by Year")+theme(plot.title=element_text(size=rel(1.5),vjust=.9))

strike_militry

Now, let’s take a look at which aircraft operators have experienced the most accidents over the last 24 years. The code below sends a query to the database connection that summarizes the incidents by operator:

1
2
3
4
5
6
7
8
9
strikes.oper <- sqlQuery(channel,"SELECT [OPERATOR] AS [Name],
                                      COUNT(*) AS [Count]
                                      FROM [StrikeReport]
                                      GROUP BY [OPERATOR]
                                      ORDER BY COUNT(*) DESC")
 
opr.order <- strikes.oper$Name[order(strikes.oper$Count)]
strikes.oper$Name <- factor(strikes.oper$Name,levels=opr.order)
strikes.oper

oper

In this case, the data were not ordered upon extraction, so the two lines after the SQL query reorder the strikes.oper vector by strike count.

We can now use this data to visualize the top 30 operators with a dot plot:

1
2
3
4
5
ggplot(strikes.oper[2:31,],aes(x=Count,y=Name))+geom_segment(aes(yend=Name), xend=0, colour="grey50") +
  geom_point(size=3.5,colour="#2E64FE")+
  theme_bw() +
  theme(panel.grid.major.y = element_blank())+
  ggtitle("Strike Incidents by Operator, 1990-Present ")+theme(plot.title=element_text(size=rel(1.5),vjust=.9))

strike_oper

It turns out United Airlines happens to have the most incidents, followed by an ambiguous class called “Business” (perhaps private aircraft), the military, and Southwest Airlines. Keep in mind that this says nothing about the frequency of such incidents, only the magnitude. We’ll need more data in order to make inferences about things like safety. It could be the case that United and Southwest are relatively safe airlines, but only have many incidents because they fly the most hours.

So, which animals happen to have the most strike incidents? The code below summaries the data and plots it in a dot plot:

1
2
3
4
5
6
7
8
9
10
11
12
13
14
strikes.spec <- sqlQuery(channel,"SELECT [Species],
                                      COUNT(*) AS [Count]
                                      FROM [StrikeReport]
                                      GROUP BY [SPECIES]
                                      ORDER BY COUNT(*) DESC")
 
spec.order <- strikes.spec$Species[order(strikes.spec$Count)]
strikes.spec$Species <- factor(strikes.spec$Species,levels=spec.order)
 
ggplot(strikes.spec[1:30,],aes(x=Count,y=Species))+geom_segment(aes(yend=Species), xend=0, colour="grey50") +
  geom_point(size=3.5,colour="#FF0000")+
  theme_bw() +
  theme(panel.grid.major.y = element_blank())+
  ggtitle("Strike Incidents by Species, 1990-Present")+theme(plot.title=element_text(size=rel(1.5),vjust=.9))

strike_spec

Most of the time, the type of animal is unidentifiable (go figure), but when it is the most likely case is that it’s a gull or a mourning dove. There are many more species in the database than are depicted in the chart above, which only has the top 30. Below is a partial list of species:

spec

Interestingly, I saw some land animals in the dataset, such as elk, caribou, and aligators (not shown above, but you can see coyotes).

Posted in: Logs, Mathematics / Tagged: bird strike, bird strike R, bird strike statistics, FAA strike wildlife strike database, ggplot2, visualizing data, wildlife strike statistics

No. 97: Project Euler #2 – Even Fibonacci Numbers

19 August, 2013 6:54 PM / Leave a Comment / Gene Dan

Question:

Each new term in the Fibonacci sequence is generated by adding the previous two terms. By starting with 1 and 2, the first 10 terms will be:

1, 2, 3, 5, 8, 13, 21, 34, 55, 89, …

By considering the terms in the Fibonacci sequence whose values do not exceed four million, find the sum of the even-valued terms.

Background:

There are some interesting things to note about Fibonnaci. Students often get their first introduction to the Fibonacci numbers when they first learn about sequences. The popular story is that they were used by Fibonacci to model rabbit populations over a period of time – you start with one pair of rabbits, denoted by 1 as the first term of the sequence. After a month, this pair of rabbits produces another pair, and now the total number of pairs is two. After another month, these two pairs produce another pair, resulting in a total of three pairs after two months. After three months, these three pairs produce 2 additional pairs, resulting in a total of five. The sequence then continues indefinitely, and students are often surprised at how quickly the terms grow.

Beyond the Fibonnaci numbers, there are some more interesting things about the mathematician for whom they are named, and how he fits in with the history of mathematics. While the Fibonacci numbers may be the most widespread way in which people are aware of Fibonacci’s existence, they are not (at least in my opinion), his most important contribution to western mathematics. Although the Fibonacci numbers appear in his book, Liber Abaci, the book itself also introduces the Hindu-Arabic number system, and it was this book that played a crucial role in popularizing the Arabic numerals – the numbers we use today – in western society. Prior to that, Europeans relied on Roman Numerals, which were cumbersome when it came to calculation. Even though the Arabic numerals appeared in Liber Abaci in 1202, it took another 400 years until they became ubiquitous throughout Europe, when the invention of the printing press aided in its widespread adoption.

Approach:

This problem is fairly straightforward. The description already tells you how to calculate the Fibonnaci numbers, and simply asks you to find the sum of the even valued terms which are less than four million. With some time and effort, you could easily do the problem by hand, although there is more educational value beyond simple addition (and efficiency!) if you solve it with a computer program. When I start out on these problems, I first create a mental outline of the solution, typically starting with brute force, and if I realize that a brute force solution would take too long, I try to come up with an indirect approach that may be more efficient. In this case the problem is simple, so I decided to use brute force. Here are steps in my mental outline:

  1. Generate the sequence of all Fibonacci numbers that are less than 4,000,000.
  2. Determine which numbers of the sequence are even numbers, then extract this subset.
  3. Add the subset of these even numbers. This will be the solution.

Solution 1:

1
2
3
4
5
6
7
8
9
x <- c(1,2)
k = 3
i = 3
while(k<=4000000){
  x <- append(x,k)
  k = k + x[i-1]
  i = i +1
}
sum(x[x%%2==0])

For this solution, I first created a vector x containing the first two seed values, 1 and 2. This vector will be used to store the sequence of Fibonnaci numbers under 4 million. Next, I declared variables k and i, starting at 3 to be used as indices in the while loop that is used to calculate the terms of the sequence. I used a while loop because I do not know (at the time of writing the solution) the number of terms that fall below 4 million. The while loop allows me to keep appending terms to the vector x so long as the terms are less than four million. Once the value of the next term exceeds four million, the program exits the loop and moves on to the next line after the loop.

Within the loop itself, you see the line x <- append(x,k). This tells the program to append the value of k=3 to the vector x, or in other words, to append the third term of the Fibonacci sequence. The next line, k = k + x[i-1], sets k equal to its current value plus the value of the second to last element of the vector x (denoted by i-1, since there are currently i elements of the vector x). In other words, set k = 5. Then i = i +1 tells the program to increment i by 1, or in other words, set i equal to 4, which will be used to index the vector x during the loop’s next iteration when there will be four elements in the vector x.

During the next iteration of the loop, k is now equal to 5, i is now equal to 4. Append k to x so that the sequence becomes (1,2,3,5). Then set k = 5+3 = 8. Then set i = 4+1 = 5. The loop continues until all the terms of the Fibonacci sequence under 4 million are contained in x.
The last line of the program tells the computer to take the sum of all the even elements of x. The index[x%%2==0] is a predicate telling the computer to extract the subset of x where 2 divides each element evenly. The %% operator is the modulo operator, which returns the remainder of x and 2. When the remainder is equal to 0, that means 2 divides x evenly. The sum over the subset returned is the answer, 4,613,732.

Solution 2:

1
2
3
4
5
6
7
x <- c(1,2)
k = 3
while(k<=4000000){
  x <- append(x,k)
  k = k + max(x[x<k])
}
sum(x[x%%2==0])

In this solution, I was able to remove the variable i, by noticing that it was sufficient to calculate the next term of the Fibonacci sequence by adding the largest two terms of the vector x. This calculation is represented by the line k = k + max(x[x<k]).

Solution 3:

1
2
3
4
5
x <- c(1,2)
while(max(x)<=4000000){
  x <- append(x,max(x)+max(x[x<max(x)]))
}
sum(x[x%%2==0])

Here, I was able to shorten the solution to five lines by removing the variable k. Here, I tell the the program to simply append to x, the sum of the current largest two values of x. This calculation is represented by the line x <- append(x,max(x)+max(x[x<max(x)])).

Posted in: Logs, Mathematics / Tagged: even fibonacci numbers, fibonacci, fibonacci numbers, project euler #2, project euler 2 R, R

No. 95: My Thoughts on Computer Literacy

12 August, 2013 9:12 PM / Leave a Comment / Gene Dan

Last week, I ran across an article on Hacker News. It was written by a school teacher who bemoaned the lack of computer literacy amongst today’s youth. The basic idea is that despite the stereotype that kids these days are a bunch of tech-savvy computer wizards, it is actually the case that the opposite is true – kids can’t really use computers. The author contends that the increasing ease of use of computers, along with the increase in the consumption of entertainment media amongst today’s youths has brought about a corresponding decline in their ability to understand how computers work, and how to use them to solve problems.

I personally thought the blog post was one of the best pieces of news I had read all week, but based on the comments I’ve seen it looks like many people thought otherwise. Most of the posters on Reddit thought the author was a stereotypical, arrogant IT nerd, whereas most of the users on Hacker News were more supportive. In the midst of the author’s bitter ranting, I think many of the readers overlooked what I thought was the most important piece of his article:

Tomorrow’s politicians, civil servants, police officers, teachers, journalists and CEOs are being created today. These people don’t know how to use computers, yet they are going to be creating laws regarding computers, enforcing laws regarding computers, educating the youth about computers, reporting in the media about computers and lobbying politicians about computers.

I think the main flaw of the article is that the author spent too much time ranting about people’s struggles with basic troubleshooting and not enough time expanding on technological illiteracy’s greater impact on society regarding the freedom of speech, censorship, and governmental control. Nevertheless, I encourage anyone who is interested to read the whole thing.

My Thoughts

1. Breaking Stuff

When I was growing up, I was lucky enough to have access to computers at a time when they cost $10k per unit. However, as a child, I never put much thought into what computers could do other than to serve as a station on which I could play video games. I had a vague idea that they could be used for more important things, but I didn’t have any understanding as to what those things were. All I knew was that Dad would leave for work at 5:00 AM in the morning, do things on a computer he used at work and then return home, and as a result of that activity we were able to afford things like food and shelter. What I do remember is that like most kids, I would mess around with stuff at home and computers were no different – I would fiddle around with the settings and configurations, install random software and so on and so forth, which often led to things like system failures, viruses, and so on and so forth. As a result, my Dad would get angry (understandably), spend many hours restoring the machine to its pristine state, and give me a stern warning not to screw it up again.

That tone continued throughout high school and college – my parents provided me with most of what I needed, using their hard-earned money to pay for it. As a result, I was discouraged from experimenting with our possessions (as experimentation usually led to breakage). After college, I started having an interest in computers, and when I became financially independent, one of the first things I did was buy a whole bunch of computer parts and put together a machine by myself. Overall, the process was pretty easy, but I did make some mistakes on my first try – I accidentally destroyed my CPU and broke off some parts of my original motherboard, resulting in me spending hundreds of dollars replacing the parts. However, through these mistakes I became better at assembling computers, and became more careful while handling the parts. Furthermore, since I had my own financial stake in the equipment, I paid more attention to maintenance and I put more effort into repairing things when they stopped working.

I think kids should be encouraged to mess around with their possessions, on the condition that they learn how to repair them if they accidentally break them. This approach requires a bit more financial investment as parts need to be replaced if all options of repair have been exhausted. Because of this, replacement should only be done if it’s an absolute necessity – otherwise if kids knew they’d get everything they break replaced, they wouldn’t try as hard to fix the things they already have. I believe that breaking things – and subsequently repairing things – teaches people the limits of what their possessions can and can’t do, and under appropriate constraints, gives them more control, knowledge, and appreciation of their belongings.

2. The Spread of Ideas

The internet is a wonderful thing. The internet has give us access to information that we would have otherwise had to either spend lots of money, travel great distances, or wait for extraordinarily long periods of time to obtain. The internet has not only greatly reduced the cost of knowledge but also the cost of communication – it is no longer necessary for people of similar interests to meet in a single physical location to share their ideas. For instance, suppose you were an expert in a particular area of mathematics working on a problem that perhaps only you and five other people could understand. Without the internet, you might have never known about these other people’s existence, but now the internet has allowed experts to collaborate with each other and solve problems.

When I was growing up, I was interested in a number of subjects that I simply did not have access to. The local library’s selection was sparse and didn’t contain the appropriate volumes for my reading level. Now that internet use has become ubiquitous, I can find much of the information I want for free, and if I wanted to obtain a copy of a book on an academic subject such as Topology, Analysis, or Computer Science, I can choose from pretty much any book that’s currently in print. Rare books – such as George Carr’s Formulas and Theorems in Pure Mathematics and even the Voynich Manuscript (of which there is only one original copy), are available for free.

What this means is that the internet, driven by computers, not only allows people to acquire knowledge, share ideas, and solve problems incredibly quickly, but also increases opportunity for the common person. For instance, If I wanted to find someone who could build me specialized equipment for an experiment, I could do it pretty easily via the internet – this allows the builder to find a customer who’s willing to pay for his services, and for me to obtain the equipment I need. Easy access to communication makes both parties better off.

3. On Censorship, Freedom of Speech, and Control

Our ability to communicate not only dictates how we are able to share ideas, but also our ability to think. In our society, we are electing officials who will enact laws governing our nation’s telecommunications infrastructure. The level of technological literacy amongst the population not only directly affects the pool of competent candidates from which to choose from, but also our ability to determine which candidates are technologically competent enough to make decisions regarding what we can and cannot do with our computers.

There are many dimensions to this problem. First, a low level of technological literacy means that knowledge – and hence power – resides within the hands of a few people. Concentrated knowledge allows the people who hold this knowledge to take advantage of those who are ignorant. People who are not aware of how far technology permeates society aren’t thinking about how technology can be used to control our thoughts and our actions, or how it could be used to imprison people and deny them a right to a fair trial. Second, a low level of technological literacy means that society cannot accurately judge a leader’s competence regarding technical matters. We could very well, through complete ignorance, elect a leader who cannot make the right decisions when it comes to enacting laws. Third, technological illiteracy hinders our ability to prioritize how we invest our resources into our economy and society. For the reasons stated in (2), a fast and reliable communications network improves the knowledge base of the populace and allows them to take action to better their own lives through the sharing of ideas, along with the exchange of physical goods and services.

And finally, on censorship. Humans communicate with each other via mutually intelligible signals, such as language. Language allows people to transmit ideas across physical distances, and with the aid of encryption, they are able to do so very securely without the fear of interception. The freedom of thought and speech is critical to our survival – it allows us to comprehend how an authority figure might be abusing its power – and when such abuses are discovered, it allows the discoverer to transmit information about such abuses across a communications network and from there on the information will be acquired and digested by the populace. Access to such information, granted through the freedom of communication allows people to collaborate, take action against such abuses and hence improve their own circumstances.

So why does technological literacy play such a crucial role with respect to the freedom of speech? Most people would regard the freedom of speech as being important but they aren’t thinking hard about why they ought to learn about technology in order to defend it. Technological literacy allows us not only understand what technology can and cannot do, but also gives us a realistic picture of the current challenges we face when it comes to things like cybersecurity and regulation. There is a lot of fear being propagated by the media on cyber attacks, malware, hackers, and so on and so forth – and such fear is often used as an excuse to enact laws that curtail our freedom. Censorship forbids us to transmit certain types of information – and hence certain types of thought across cyberspace. It restricts access to information and the sharing of ideas, and from there the sharing of goods and services, along with the ability for people to collaborate with one another for their own good. With censorship, social progress comes to a halt. It is therefore to our benefit that we promote literacy amongst the population to enable ourselves to take action against what we see as unjust, and to protect our freedom to better our own lives.

Posted in: Logs

Post Navigation

« Previous 1 2 3 4 … 19 Next »

Archives

  • September 2023
  • February 2023
  • January 2023
  • October 2022
  • March 2022
  • February 2022
  • December 2021
  • July 2020
  • June 2020
  • May 2020
  • May 2019
  • April 2019
  • November 2018
  • September 2018
  • August 2018
  • December 2017
  • July 2017
  • March 2017
  • November 2016
  • December 2014
  • November 2014
  • October 2014
  • August 2014
  • July 2014
  • June 2014
  • February 2014
  • December 2013
  • October 2013
  • August 2013
  • July 2013
  • June 2013
  • March 2013
  • January 2013
  • November 2012
  • October 2012
  • September 2012
  • August 2012
  • July 2012
  • June 2012
  • May 2012
  • April 2012
  • March 2012
  • February 2012
  • January 2012
  • December 2011
  • September 2011
  • August 2011
  • July 2011
  • June 2011
  • January 2011
  • December 2010
  • October 2010
  • September 2010
  • August 2010
  • June 2010
  • May 2010
  • April 2010
  • March 2010
  • September 2009
  • August 2009
  • May 2009
  • December 2008

Categories

  • Actuarial
  • Cycling
  • Logs
  • Mathematics
  • MIES
  • Music
  • Uncategorized

Links

Cyclingnews
Jason Lee
Knitted Together
Megan Turley
Shama Cycles
Shama Cycles Blog
South Central Collegiate Cycling Conference
Texas Bicycle Racing Association
Texbiker.net
Tiffany Chan
USA Cycling
VeloNews

Texas Cycling

Cameron Lindsay
Jacob Dodson
Ken Day
Texas Cycling
Texas Cycling Blog
Whitney Schultz
© Copyright 2025 - Gene Dan's Blog
Infinity Theme by DesignCoral / WordPress