• Home
  • Readings
  • Github
  • MIES
  • TmVal
  • About
Gene Dan's Blog

Category Archives: Uncategorized

No. 131: Clearing a 12,000 Card Backlog

14 April, 2019 11:33 PM / 5 Comments / Gene Dan

Around this time last year, I was frantically studying for my last actuarial exam. With the future of my career on the line, I decided that in the three to four months leading up to my exam, I would drop everything – that is, exercise, hobbies, social activities, and academic interests – to study for this exam. This was an unprecedented move on my end, as I had, up to that point in my career, maintained my outside interests while simultaneously preparing for my exams. However, I believed that since this was my last exam, and with no fall exam on the horizon, that I would be able to catch up on these things later.

The good news is that I passed, after having put in about 6 hours of study per day over the course of 100 days. The bad news is that I had put the rest of my life on hold, including my (hopefully) lifelong experiment with spaced repetition, using Anki. For those of you who are new to this, spaced repetition is an optimized technique for memory retention – you can read more about it here. Halting progress on notecard reviews is problematic, for a couple of reasons:

  1. There is no way to pause Anki. Anki will keep scheduling cards even when you aren’t reviewing them, so it can be very difficult to catch up on your reviews, even if you’ve missed just a few days.
  2. Anki schedules cards shortly before you’re about to forget them, which is the best time to review the cards for maximum retention. Because of this, you are likely to forget many of the cards that are on backlog.

Thus, despite the relief I felt over never having to take an actuarial exam ever again, I faced the daunting task of getting back to normal with my Anki reviews. Since I use Anki as a permanent memory bank of sorts, I never delete any of the cards I add – that means I cumulatively review everything I have ever added to my deck over the last five years. This makes the issues I outlined above particularly problematic.

Upon waking up the day after my exam, I discovered that I had over 12,000 cards to review, a backlog which had accumulated over the past three months:

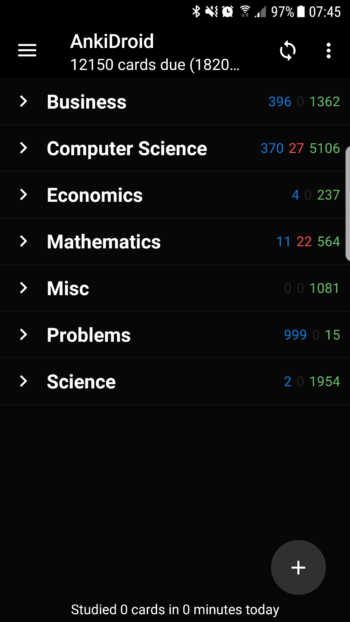
Although I was eager to resume my studies, this backlog would be something I would have to deal with first, since it would be difficult for me to review new material without taking care of the old material first. I assume that most people would simply nuke their collection and start over, but since I had been using Anki for several years, I was confident I’d be able to get through this without having to delete any of my cards.

The first step was to pick the number of reviews I would have to do per day. The tricky part was that if I did too few, the backlog would continue to grow. However, there was no way for me to get through all 12,000 cards within a single day. I settled on starting with 500 reviews per day – a nice, round number that I could easily increase if I noticed I was falling behind.

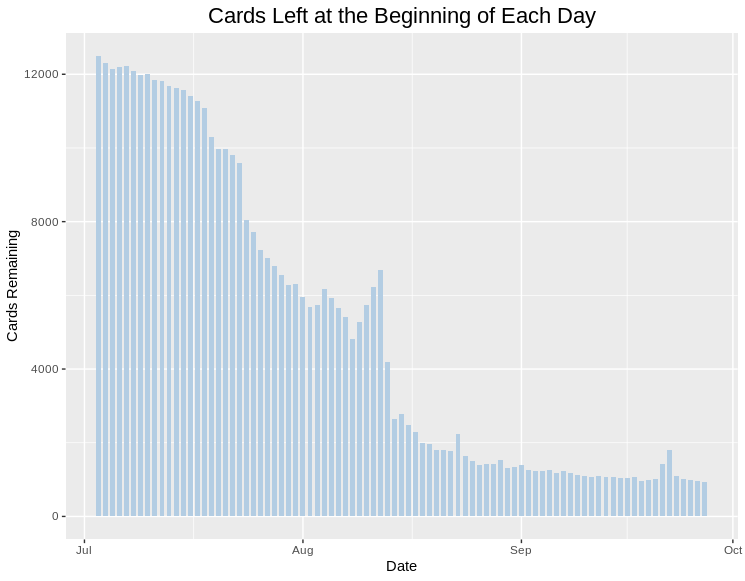
As the days went by, I recorded the number of reviews I had remaining at the start of each day in a file called cardsleft.csv. The graph below shows that it took about three months to reach a level of about 1,000 cards per day, which was the point at which I declared the backlog to be cleared:

R
1
2
3
4
5
6
7
8
library(tidyverse)
library(RSQLite)
library(rjson)
library(sqldf)
library(treemap)
library(anytime)
library(zoo)
library(reshape2)

R
1
2
3
4
5
6
7
8
9
10
cardsleft <- read.csv("cardsleft.csv", header=TRUE)
cardsleft$date <- as.Date(cardsleft$date, "%m/%d/%y")
 
ggplot(cardsleft, aes(x = date, y = cardsleft)) +
  geom_bar(stat="identity", width = 0.7, fill = "#B3CDE3") +
  ggtitle("Cards Left at the Beginning of Each Day") +
  xlab("Date") +
  ylab("Cards Remaining") +
  theme(plot.title=element_text(size=rel(1.5),vjust=.9,hjust=.5)) +
  guides(fill = guide_legend(reverse = TRUE))

I worked my way through my collection one deck at a time, starting with programming languages, since I wanted to start studying a new JavaScript book as soon as possible. Once that deck was cleared, I started adding new cards pertaining to JavaScript, while simultaneously clearing the backlog in the remaining decks.

That’s all I had to do, and all it took was a bit of consistency and perseverance over three months. Now things are back to normal – I normally review 800 – 1200 cards per day.

Other Spaced Repetition Updates

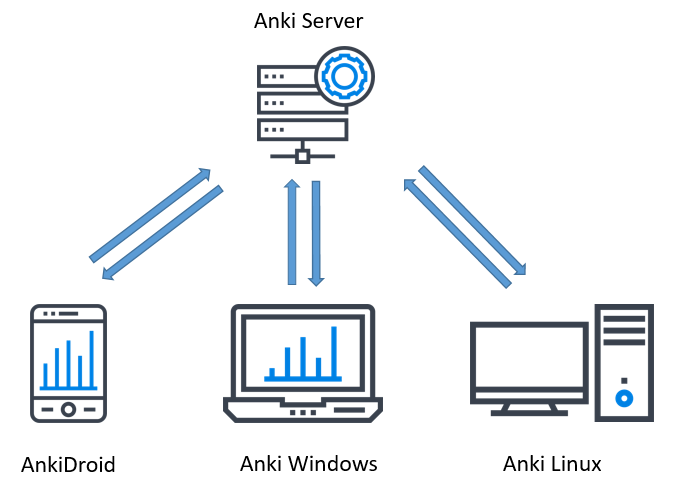
It’s been a little more than a year since I last wrote about spaced repetition. I’m happy to say that my experiment is still going strong, and my personal goal of never deleting any cards has not placed an undue burden on my livelihood or on my ability to study new material. Since Anki stores its information in a SQLite database, you can directly connect to it with R to analyze its contents.

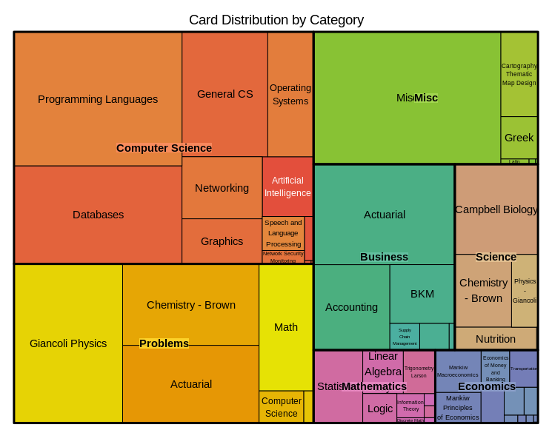
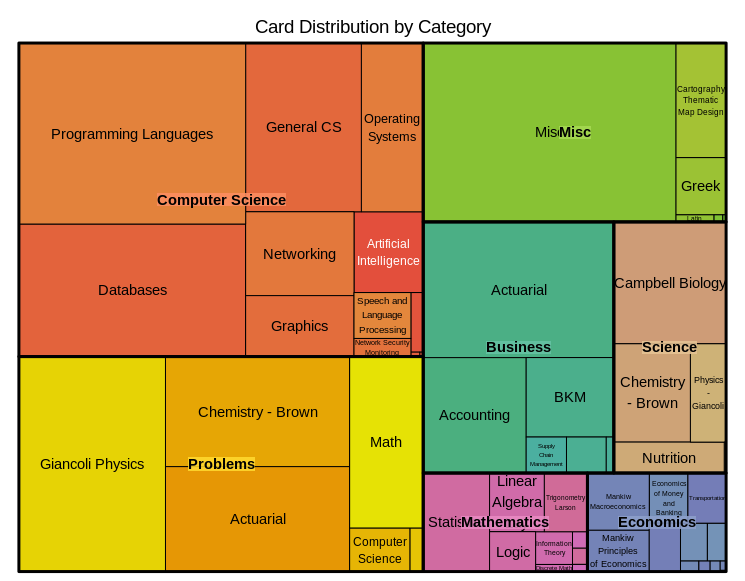
For the most part, the deck composition by subject has remained similar, but the computer science portion has increased due to my focus on databases, JavaScript, Git, and R:

R
1
2
3
4
5
6
7
8
9
10
11
12
13
14
15
16
17
18
19
20
21
22
23
24
25
26
27
28
29
30
31
32
33
34
35
36
37
38
39
40
41
42
43
con = dbConnect(SQLite(), dbname = "collection.anki2")


con = dbConnect(RSQLite::SQLite(),dbname="collection.anki2")
 
#get reviews
rev <- dbGetQuery(con,'select CAST(id as TEXT) as id
                  , CAST(cid as TEXT) as cid
                  , time
                  from revlog')
 
cards <- dbGetQuery(con,'select CAST(id as TEXT) as cid, CAST(did as TEXT) as did from cards')
 
#Get deck info - from the decks field in the col table
deckinfo <- as.character(dbGetQuery(con,'select decks from col'))
decks <- fromJSON(deckinfo)
 
names <- c()
did <- names(decks)
for(i in 1:length(did))
{
  names[i] <- decks[[did[i]]]$name
}
 
decks <- data.frame(cbind(did,names))
decks$names <- as.character(decks$names)
decks$actuarial <- ifelse(regexpr('[Aa]ctuar',decks$names) > 0,1,0)
decks$category <- gsub(":.*$","",decks$names)
decks$subcategory <- sub("::","/",decks$names)
decks$subcategory <- sub(".*/","",decks$subcategory)
decks$subcategory <- gsub(":.*$","",decks$subcategory)
 
 
cards_w_decks <- merge(cards,decks,by="did")
 
deck_summary <- sqldf("SELECT category, subcategory, count(*) as n_cards from cards_w_decks group by category, subcategory")
treemap(deck_summary,
        index=c("category","subcategory"),
        vSize="n_cards",
        type="index",
        palette = "Set2",
        title="Card Distribution by Category")

In the time that has passed, my deck as grown from about 40,000 cards to 50,000 cards:

R
1
2
3
4
5
6
7
8
9
10
cards$created_date <- as.yearmon(anydate(as.numeric(cards$cid)/1000))
cards_summary <- sqldf("select created_date, count(*) as n_cards from cards group by created_date order by created_date")
cards_summary$deck_size <- cumsum(cards_summary$n_cards)
 
ggplot(cards_summary,aes(x=created_date,y=deck_size))+geom_bar(stat="identity",fill="#B3CDE3")+
  ggtitle("Cumulative Deck Size") +
  xlab("Year") +
  ylab("Number of Cards") +
  theme(plot.title=element_text(size=rel(1.5),vjust=.9,hjust=.5)) +
  guides(fill = guide_legend(reverse = TRUE))

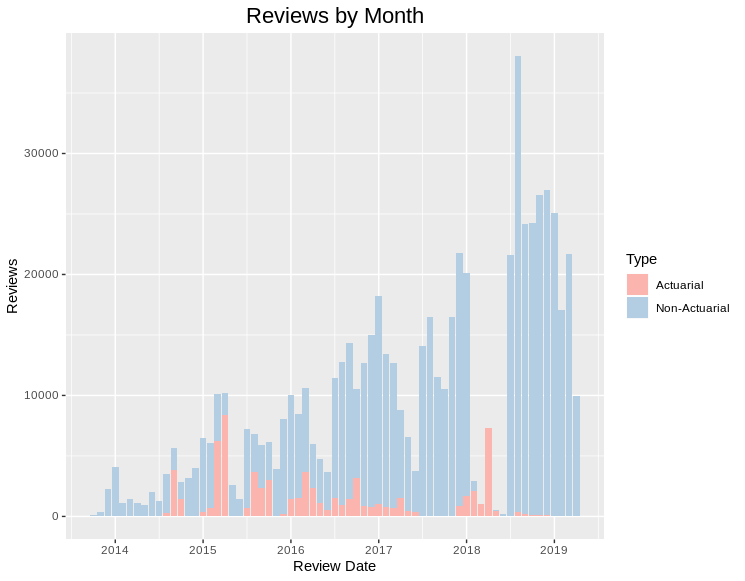
And, thankfully, the proportion of my time preparing for actuarial exams has dropped to near zero:

R
1
2
3
4
5
6
7
8
9
10
11
12
13
14
15
16
17
18
19
20
21
#Date is UNIX timestamp in milliseconds, divide by 1000 to get seconds
rev$revdate <- as.yearmon(anydate(as.numeric(rev$id)/1000))
 
#Assign deck info to reviews
rev_w_decks <- merge(rev,cards_w_decks,by="cid")
rev_summary <- sqldf("select revdate,sum(case when actuarial = 0 then 1 else 0 end) as non_actuarial,sum(actuarial) as actuarial from rev_w_decks group by revdate")
rev_counts <- melt(rev_summary, id.vars="revdate")
names(rev_counts) <- c("revdate","Type","Reviews")
rev_counts$Type <- ifelse(rev_counts$Type=="non_actuarial","Non-Actuarial","Actuarial")
rev_counts <- rev_counts[order(rev(rev_counts$Type)),]
 
rev_counts$Type <- as.factor(rev_counts$Type)
rev_counts$Type <- relevel(rev_counts$Type, 'Non-Actuarial')
 
ggplot(rev_counts,aes(x=revdate,y=Reviews,fill=Type))+geom_bar(stat="identity")+
  scale_fill_brewer(palette="Pastel1",direction=-1)+
  ggtitle("Reviews by Month") +
  xlab("Review Date") +
  scale_x_continuous(breaks = pretty(rev_counts$revdate, n = 6)) +
  theme(plot.title=element_text(size=rel(1.5),vjust=.9,hjust=.5)) +
  guides(fill = guide_legend(reverse = TRUE))

Posted in: Uncategorized

No. 130: Introducing MIES – A Miniature Insurance Economic Simulator

26 November, 2018 12:31 AM / Leave a Comment / Gene Dan

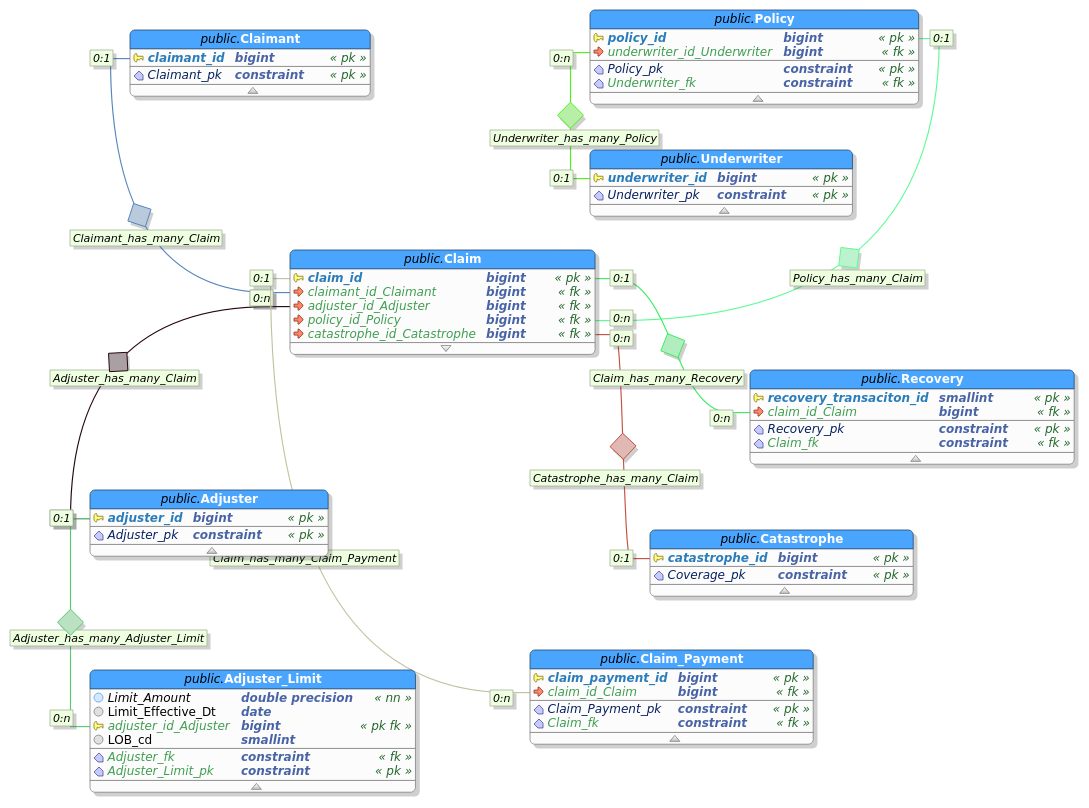
MIES, standing for Miniature Insurance Economic Simulator, is a side project of mine that was originally conceived in 2013. The goal of MIES is to create a realistic, but simplified representation of an insurance company ERP, populate it with simulated data, and from there use it to test economic and actuarial theories found in academic literature. From this template, multiple firms can then be created, which can then be used to test inter-firm competition, the effects of which will be manifested via the simulated population of insureds.

Inspiration for the project came from the early days of my career, when I was first learning how to program computers. While I found ample general-purpose material online for popular languages such as Python, R, and SQL, little existed as far as insurance-specific applications. Likewise, from an insurance perspective, plenty of papers were available from the CAS, but they were mostly theoretical in nature and lacked the practical aspects of using numerical programming to conduct actuarial work – i.e., using SQL to pull from databases, what a typical insurance data warehouse looks like, how to build a pricing model with R, etc.

I had hoped to bridge that gap by creating a mock-up of an insurance data warehouse that could be used to practice SQL queries against, thus bridging the gap between theory and practice, and creating a resource that other actuaries and students could use to further their own education. I then realized that not only would I be able to simulate a single company’s operations, but I’d also be able to simulate firm interactions by cloning the database template and deploying competing firm strategies against each other. And furthermore, should I succeed in creating a robust simulation engine, I would be able to incorporate and test open source actuarial libraries written by others.

I would have liked to introduce this project later, but I figured if I were to reveal pieces of the project (like I did with the last post) without an overarching framework, readers wouldn’t really get the point of what I was trying to achieve. Back in 2013, the project stalled due to exams, and my lack of technical knowledge and insurance experience. Now that I’ve worked for a bit and finished my exams, I can continue work on this more regularly. Below, I present a high-level schematic of the MIES engine:

The image above displays two of the three layers of the engine – an environment layer that is used to simulate the world in which firms and the individuals they hope to insure interact, and a firm layer that stores each firm’s ERP and corporate strategy.

  • Environment Layer
  • The environment layer simulates the population of potential insureds who are subject to everyday perils that insurance companies hope to insure. The environment module will be a program (or collection of programs) that provides the macroeconomic (GDP, unemployment, inflation), microeconomic (individual wealth, utility curves, births and deaths), sociodemographic (race, religion, household income, commute time), and other environmental parameters such as weather, to represent everyday people and the challenges they face. The simulated data are stored in a database (or a portion of a very large database) called the environmental database.

    A module called the information filter then reads the environmental data and filters out information that can’t be seen by individual firms. Firms try to get as much data as they can about their potential customers, but they won’t be able to know everything about them. Therefore, firms act on incomplete information, and the information filter is designed to remove information that companies can’t access.

  • Firm Layer
  • The firm layer is a collection of firm strategies – each of which is a program that represents the firm’s corporate strategy (pricing, reserving, marketing, claims, human resources, etc.), along with a set of firm ERPs which store the information resulting from each firm’s operations (premiums, claims, financial statements, employees).

The environment layer then simulates policies written and claims incurred, which are then stored in their respective firm’s ERPs. The result of all this is a set of economic equilibria – that is, insurance market prices, adequacy, availability, etc. Information generated from both the environment and firm layers are then fed back into the environment module as a form of feedback that influences the next iteration’s simulation.

The image below represents a simple breakdown of an individual firm ERP:

Here, we have the third layer of MIES – the user interface layer.

  • Underwriting System
  • An underwriting system is a platform that an insurer uses to write policies. I’ll try my best to use an available open-source engine for this (possibly openunderwriter). The frontend will be visible if a human actor is involved, otherwise, it will be driven behind the scenes programmatically.

  • Claims System
  • A claims system is a platform that an insurer uses to manage and settle insurance claims. On top of the claims system is the actuarial reserving interface (triangles).

  • General Ledger
  • The general ledger stores accounting information that is used to produce financial statements. Current candidates for this system include ledger-cli and LedgerSMB.

Below, is a rudimentary claims database schema, containing primary-foreign key relationships, but no other attributes (to be added later):

I’m using PostgreSQL for the database system, and MIES itself will be hosted on my AWS cloud account as a web-based application. I’m currently exploring Apache and serverless options as a host. The MIES engine itself was originally being scripted in Scala (I was really into Spark at the time) but will now be done in Python to reach a wider audience (I may revisit Scala if the data becomes big – hopefully I’ll be able to get some kind of funding for hosting fees if that happens).

With this ecosystem, I aim to reconcile micro- and macroeconomic theory, and study the effects of firm competition, oligopoly, and bankruptcy on the well-being of insureds. The engine will serve as the basis for other actuarial libraries and will incorporate pricing, reserving, and ERP systems that could eventually become standalone open-source applications for the insurance industry. Stay tuned for updates, and check the github repo regularly to see the project progress.

Posted in: Uncategorized / Tagged: actuarial science, insurance, MIES

No. 129: Triangles on the Web

16 September, 2018 8:33 PM / Leave a Comment / Gene Dan

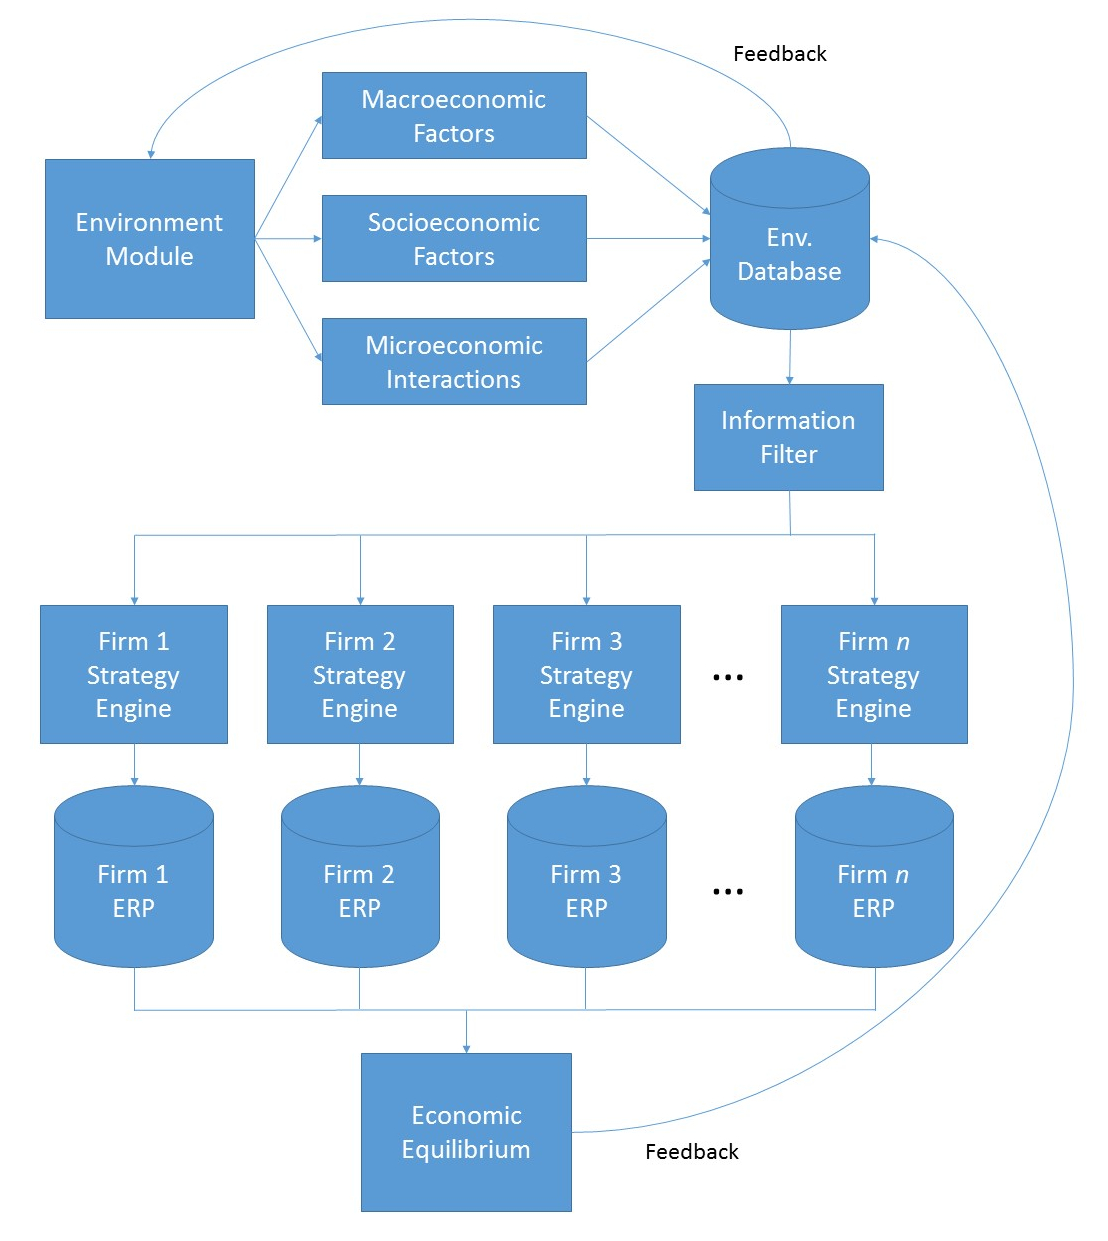
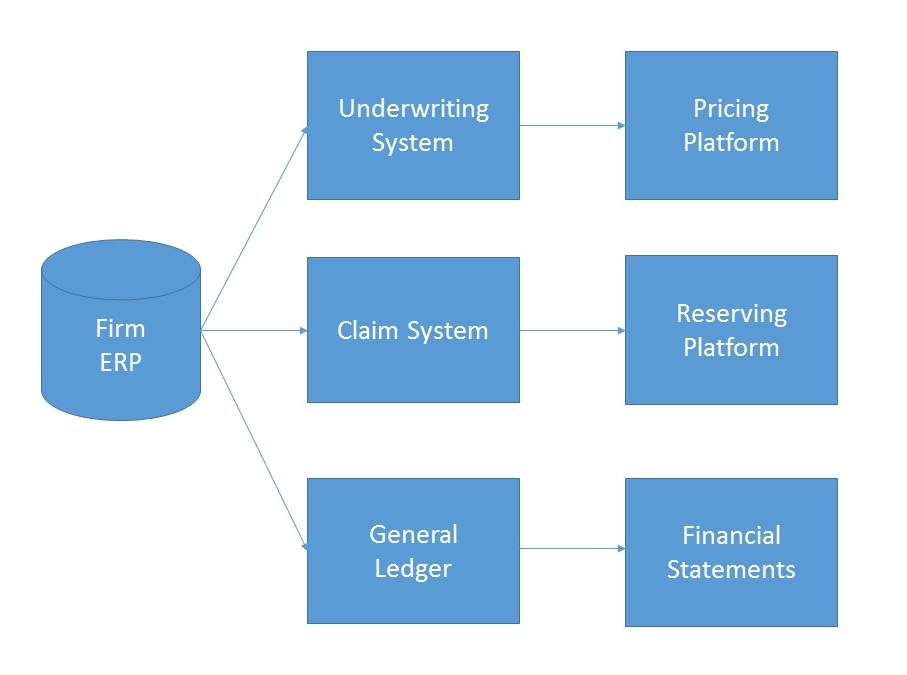
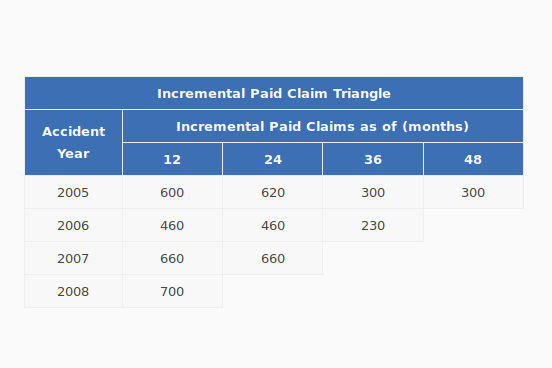
A triangle is a data structure commonly used by actuaries to estimate reserves for insurance companies. Without going into too much detail, a reserve is money that an insurance company sets aside to pay claims on a book of policies. The reason why reserves must be estimated is due to the uncertain nature of the business – that is, for every policy sold, it is unknown at the time of sale whether or not the insured will suffer a claim over the policy period, nor is it known with certainty how many claims the insured will file, or how much the company will have to pay in order to settle those claims. Yet, the insurance company still needs to have funds available to satisfy its contractual obligations – hence, the need for actuaries.

Triangles are popular amongst actuaries because they provide a compact summarization of claims transactions, and are an elegant visual representation of claims development. They are furthermore amenable to several algorithms that are used to estimate the reserves, such as chain ladder, Bornhuetter-Ferguson, and ODP Bootstrap.

I had originally set out to do something more ambitious for today – that is, to automate the production of browser-based triangles via JavaScript, but I’m not quite there yet with my studies in the language, and moreover simply setting up pieces of the frontend involved enough work and learning to merit its own post.

Today, I’ll go over the visual presentation of actuarial triangles in HTML, while later posts will cover automating their production via JavaScript, JSON, and backend calculations.

Below, you’ll find a table of 15 claims, taken from Friedland’s text on claims reserving. The Claim ID is simply a value to identify a particular claim. The other two columns have the following definitions:

  • Accident Date
  • The accident date is the date on which the claim occurs. For example, if you were driving on January 5 and had an accident during that trip, then January 5 would be the accident date.

  • Report Date
  • The report date is the date on which the claim is reported to the insurer. If you were driving around on January 5 and had an accident during that trip, but didn’t notify the insurance company until February 1, then February 1 would be the report date.

You may be wondering why actuaries would care about the distinction. In the table below, you see that at worst, claims are reported only a few months after they occur. In certain lines of business, however, claims can be reported even many years after they occur. One example would be asbestos claims, in which cancer may not develop until many years after exposure to the substance. Another would be roof damage resulting from storms, in which the homeowners may not know that their roofs are damaged until the next time they climb up to go see, which may happen some time after the storm in question.

Reported Claims
Claim ID Accident Date Report Date
1 Jan-5-05 Feb-1-05
2 May-4-05 May-15-05
3 Aug-20-05 Dec-15-05
4 Oct-28-05 May-15-06
5 Mar-3-06 Jul-1-06
6 Sep-18-06 Oct-2-06
7 Dec-1-06 Feb-15-07
8 Mar-1-07 Apr-1-07
9 Jun-15-07 Sep-9-07
10 Sep-30-07 Oct-20-07
11 Dec-12-07 Mar-10-08
12 Apr-12-08 Jun-18-08
13 May-28-08 Jul-23-08
14 Nov-12-08 Dec-5-08
13 Oct-15-08 Feb-2-09
14 Nov-12-08 Dec-5-08
15 Oct-15-08 Feb-2-09

1
2
3
4
5
6
7
8
9
10
11
12
13
14
15
16
17
18
19
20
21
22
23
24
25
26
27
28
29
30
31
32
33
34
35
36
37
38
39
40
41
42
43
44
45
46
47
48
49
50
51
52
53
54
55
56
57
58
59
60
61
62
63
64
65
66
67
68
69
70
71
72
73
74
75
76
77
78
79
80
81
82
83
84
85
86
87
88
89
90
91
92
93
94
95
<table style="width: 500px">
  <tr>
    <th colspan="3"><strong>Reported Claims</strong></th>
  </tr>
  <tr>
    <th><strong>Claim ID</strong></th>
    <th><strong>Accident Date</strong></th>
    <th><strong>Report Date</strong></th>
  </tr>
  <tr>
    <td>1</td>
    <td>Jan-5-05</td>
    <td>Feb-1-05</td>
  </tr>
  <tr>
    <td>2</td>
    <td>May-4-05</td>
    <td>May-15-05</td>
  </tr>
  <tr>
    <td>3</td>
    <td>Aug-20-05</td>
    <td>Dec-15-05</td>
  </tr>
  <tr>
    <td>4</td>
    <td>Oct-28-05</td>
    <td>May-15-06</td>
  </tr>
  <tr>
    <td>5</td>
    <td>Mar-3-06</td>
    <td>Jul-1-06</td>
  </tr>
  <tr>
    <td>6</td>
    <td>Sep-18-06</td>
    <td>Oct-2-06</td>
  </tr>
  <tr>
    <td>7</td>
    <td>Dec-1-06</td>
    <td>Feb-15-07</td>
  </tr>
  <tr>
    <td>8</td>
    <td>Mar-1-07</td>
    <td>Apr-1-07</td>
  </tr>
  <tr>
    <td>9</td>
    <td>Jun-15-07</td>
    <td>Sep-9-07</td>
  </tr>
  <tr>
    <td>10</td>
    <td>Sep-30-07</td>
    <td>Oct-20-07</td>
  </tr>
  <tr>
    <td>11</td>
    <td>Dec-12-07</td>
    <td>Mar-10-08</td>
  </tr>
  <tr>
    <td>12</td>
    <td>Apr-12-08</td>
    <td>Jun-18-08</td>
  </tr>
  <tr>
    <td>13</td>
    <td>May-28-08</td>
    <td>Jul-23-08</td>
  </tr>
  <tr>
    <td>14</td>
    <td>Nov-12-08</td>
    <td>Dec-5-08</td>
  </tr>
  <tr>
    <td>13</td>
    <td>Oct-15-08</td>
    <td>Feb-2-09</td>
  </tr>
  <tr>
    <td>14</td>
    <td>Nov-12-08</td>
    <td>Dec-5-08</td>
  </tr>
  <tr>
    <td>15</td>
    <td>Oct-15-08</td>
    <td>Feb-2-09</td>
  </tr>
</table>

There really isn’t much to it, but I did learn a few things here. In particular, the HTML attribute colspan was used on the top row header to merge the top few cells together. Furthermore, I altered a ruleset to this site’s CSS, which centered and middle-aligned the text within the table:

CSS
1
2
3
4
th, td {
    text-align: center;
  vertical-align: middle;
}

While the above table is straightforward to understand, there isn’t much that you can do with it. First, there aren’t any claim dollars attached to those claims, so we won’t be able to perform any kind of financial projections if there aren’t any historical transactions. Second, even after getting the transaction data, the presentation can get messy because the order in which transactions occur don’t always coincide with the order in which claims occur or are reported.

We see that this is the case in the table below, which shows the historical transactions for this group of claims. The first payment for claim 9 occurs before the first payment for claim 4, even though claim 4 occurred first.

Claim Payment Transactions by Calendar Year
Claim ID Accident Date Report Date Transaction Calendar Year Amount ($)
1 Jan-5-05 Feb-1-05 2005 400
2 May-4-05 May-15-05 2005 200
1 Jan-5-05 Feb-1-05 2006 220
2 May-4-05 May-15-05 2006 200
3 Aug-20-05 Dec-15-05 2006 200
5 Mar-3-06 Jul-1-06 2006 260
6 Sep-18-06 Oct-2-06 2006 200
3 Aug-20-05 Dec-15-05 2007 300
5 Mar-3-06 Jul-1-06 2007 190
7 Dec-1-06 Feb-15-07 2007 270
8 Mar-1-07 Apr-1-07 2007 200
9 Jun-15-07 Sep-9-07 2007 460
4 Oct-28-05 May-15-06 2008 300
6 Sep-18-06 Oct-2-06 2008 230
8 Mar-1-07 Apr-1-07 2008 200
10 Sep-30-07 Oct-20-07 2008 400
11 Dec-12-07 Mar-10-08 2008 60
12 Apr-12-08 Jun-18-08 2008 400
13 May-28-08 Jul-23-08 2008 300

1
2
3
4
5
6
7
8
9
10
11
12
13
14
15
16
17
18
19
20
21
22
23
24
25
26
27
28
29
30
31
32
33
34
35
36
37
38
39
40
41
42
43
44
45
46
47
48
49
50
51
52
53
54
55
56
57
58
59
60
61
62
63
64
65
66
67
68
69
70
71
72
73
74
75
76
77
78
79
80
81
82
83
84
85
86
87
88
89
90
91
92
93
94
95
96
97
98
99
100
101
102
103
104
105
106
107
108
109
110
111
112
113
114
115
116
117
118
119
120
121
122
123
124
125
126
127
128
129
130
131
132
133
134
135
136
137
138
139
140
141
142
143
144
145
<table style="width: 500px">
<tr>
   <th colspan="5"><strong>Claim Payment Transactions by Calendar Year</strong></th>
</tr>
<tr>
   <th><strong>Claim ID</strong></th>
   <th><strong>Accident Date</strong></th>
   <th><strong>Report Date</strong></th>
   <th><strong>Transaction Calendar Year</strong></th>
   <th><strong>Amount ($)</strong></th>
</tr>
<tr>
   <td>1</td>
   <td>Jan-5-05</td>
   <td>Feb-1-05</td>
   <td>2005</td>
   <td>400</td>
</tr>
<tr>
   <td>2</td>
   <td>May-4-05</td>
   <td>May-15-05</td>
   <td>2005</td>
   <td>200</td>
</tr>
<tr>
   <td>1</td>
   <td>Jan-5-05</td>
   <td>Feb-1-05</td>
   <td>2006</td>
   <td>220</td>
</tr>
<tr>
   <td>2</td>
   <td>May-4-05</td>
   <td>May-15-05</td>
   <td>2006</td>
   <td>200</td>
</tr>
<tr>
   <td>3</td>
   <td>Aug-20-05</td>
   <td>Dec-15-05</td>
   <td>2006</td>
   <td>200</td>
</tr>
<tr>
   <td>5</td>
   <td>Mar-3-06</td>
   <td>Jul-1-06</td>
   <td>2006</td>
   <td>260</td>
</tr>
<tr>
   <td>6</td>
   <td>Sep-18-06</td>
   <td>Oct-2-06</td>
   <td>2006</td>
   <td>200</td>
</tr>
<tr>
   <td>3</td>
   <td>Aug-20-05</td>
   <td>Dec-15-05</td>
   <td>2007</td>
   <td>300</td>
</tr>
<tr>
   <td>5</td>
   <td>Mar-3-06</td>
   <td>Jul-1-06</td>
   <td>2007</td>
   <td>190</td>
</tr>
<tr>
   <td>7</td>
   <td>Dec-1-06</td>
   <td>Feb-15-07</td>
   <td>2007</td>
   <td>270</td>
</tr>
<tr>
   <td>8</td>
   <td>Mar-1-07</td>
   <td>Apr-1-07</td>
   <td>2007</td>
   <td>200</td>
</tr>
<tr>
   <td>9</td>
   <td>Jun-15-07</td>
   <td>Sep-9-07</td>
   <td>2007</td>
   <td>460</td>
</tr>
<tr>
   <td>4</td>
   <td>Oct-28-05</td>
   <td>May-15-06</td>
   <td>2008</td>
   <td>300</td>
</tr>
<tr>
   <td>6</td>
   <td>Sep-18-06</td>
   <td>Oct-2-06</td>
   <td>2008</td>
   <td>230</td>
</tr>
<tr>
   <td>8</td>
   <td>Mar-1-07</td>
   <td>Apr-1-07</td>
   <td>2008</td>
   <td>200</td>
</tr>
<tr>
   <td>10</td>
   <td>Sep-30-07</td>
   <td>Oct-20-07</td>
   <td>2008</td>
   <td>400</td>
</tr>
<tr>
   <td>11</td>
   <td>Dec-12-07</td>
   <td>Mar-10-08</td>
   <td>2008</td>
   <td>60</td>
</tr>
<tr>
   <td>12</td>
   <td>Apr-12-08</td>
   <td>Jun-18-08</td>
   <td>2008</td>
   <td>400</td>
</tr>
<tr>
   <td>13</td>
   <td>May-28-08</td>
   <td>Jul-23-08</td>
   <td>2008</td>
   <td>300</td>
</tr>
</table>

A more visually appealing representation orders the claims chronologically by date of occurrence, while ordering the transactions horizontally by date of payment.

Claims Transaction Paid Claims
Claim
ID
Accident
Date
Report
Date
Incremental Payments in Calendar Year
2005 2006 2007 2008
1 Jan-5-05 Feb-1-05 400 220 0 0
2 May-4-05 May-15-05 200 200 0 0
3 Aug-20-05 Dec-15-05 0 200 300 0
4 Oct-28-05 May-15-06 0 0 300
5 Mar-3-06 Jul-1-06 260 190 0
6 Sep-18-06 Oct-2-06 200 0 230
7 Dec-1-06 Feb-15-07 270 0
8 Mar-1-07 Apr-1-07 200 200
9 Jun-15-07 Sep-9-07 460 0
10 Sep-30-07 Oct-20-07 0 400
11 Dec-12-07 Mar-10-08 60
12 Apr-12-08 Jun-18-08 400
13 May-28-08 Jul-23-08 300
14 Nov-12-08 Dec-5-08 0
15 Oct-15-08 Feb-2-09

1
2
3
4
5
6
7
8
9
10
11
12
13
14
15
16
17
18
19
20
21
22
23
24
25
26
27
28
29
30
31
32
33
34
35
36
37
38
39
40
41
42
43
44
45
46
47
48
49
50
51
52
53
54
55
56
57
58
59
60
61
62
63
64
65
66
67
68
69
70
71
72
73
74
75
76
77
78
79
80
81
82
83
84
85
86
87
88
89
90
91
92
93
94
95
96
97
98
99
100
101
102
103
104
105
106
107
108
109
110
111
112
113
114
115
116
117
118
119
120
121
122
123
124
125
126
127
128
129
130
131
132
133
134
135
136
137
138
139
140
141
142
143
144
145
146
147
148
149
150
151
<table style="width: 500px">
  <tr>
    <th colspan="7"><strong>Claims Transaction Paid Claims</strong></th>
  </tr>
    <th rowspan="2"><strong>Claim</br>ID</strong></th>
    <th rowspan="2"><strong>Accident</br>Date</strong></th>
    <th rowspan="2"><strong>Report</br>Date</strong></th>
    <th colspan="4"><strong>Incremental Payments in Calendar Year</strong></th>
  </tr>
  <tr>
    <th><strong>2005</strong></th>
    <th><strong>2006</strong></th>
    <th><strong>2007</strong></th>
    <th><strong>2008</strong></th>
  </tr>
  <tr>
    <td>1</td>
    <td>Jan-5-05</td>
    <td>Feb-1-05</td>
    <td>400</td>
    <td>220</td>
    <td>0</td>
    <td>0</td>
  </tr>
  <tr>
    <td>2</td>
    <td>May-4-05</td>
    <td>May-15-05</td>
    <td>200</td>
    <td>200</td>
    <td>0</td>
    <td>0</td>
  </tr>
  <tr>
    <td>3</td>
    <td>Aug-20-05</td>
    <td>Dec-15-05</td>
    <td>0</td>
    <td>200</td>
    <td>300</td>
    <td>0</td>
  </tr>
  <tr class="separated">
    <td>4</td>
    <td>Oct-28-05</td>
    <td>May-15-06</td>
    <td></td>
    <td>0</td>
    <td>0</td>
    <td>300</td>
  </tr>
  <tr>
    <td>5</td>
    <td>Mar-3-06</td>
    <td>Jul-1-06</td>
    <td></td>
    <td>260</td>
    <td>190</td>
    <td>0</td>
  </tr>
  <tr>
    <td>6</td>
    <td>Sep-18-06</td>
    <td>Oct-2-06</td>
    <td></td>
    <td>200</td>
    <td>0</td>
    <td>230</td>
  </tr>
  <tr class="separated">
    <td>7</td>
    <td>Dec-1-06</td>
    <td>Feb-15-07</td>
    <td></td>
    <td></td>
    <td>270</td>
    <td>0</td>
  </tr>
  <tr>
    <td>8</td>
    <td>Mar-1-07</td>
    <td>Apr-1-07</td>
    <td></td>
    <td></td>
    <td>200</td>
    <td>200</td>
  </tr>
  <tr>
    <td>9</td>
    <td>Jun-15-07</td>
    <td>Sep-9-07</td>
    <td></td>
    <td></td>
    <td>460</td>
    <td>0</td>
  </tr>
  <tr>
    <td>10</td>
    <td>Sep-30-07</td>
    <td>Oct-20-07</td>
    <td></td>
    <td></td>
    <td>0</td>
    <td>400</td>
  </tr>
  <tr class="separated">
    <td>11</td>
    <td>Dec-12-07</td>
    <td>Mar-10-08</td>
    <td></td>
    <td></td>
    <td></td>
    <td>60</td>
  </tr>
  <tr>
    <td>12</td>
    <td>Apr-12-08</td>
    <td>Jun-18-08</td>
    <td></td>
    <td></td>
    <td></td>
    <td>400</td>
  </tr>
  <tr>
    <td>13</td>
    <td>May-28-08</td>
    <td>Jul-23-08</td>
    <td></td>
    <td></td>
    <td></td>
    <td>300</td>
  </tr>
  <tr>
    <td>14</td>
    <td>Nov-12-08</td>
    <td>Dec-5-08</td>
    <td></td>
    <td></td>
    <td></td>
    <td>0</td>
  </tr>
  <tr>
    <td>15</td>
    <td>Oct-15-08</td>
    <td>Feb-2-09</td>
    <td></td>
    <td></td>
    <td></td>
    <td></td>
  </tr>
</table>

I’ve picked up a few pieces of syntax here, as not only have I made use of the colspan attribute, but also the rowspan attribute, allowing the first three subheadings of the table to occupy two rows each. Furthermore, I’ve added horizontal lines to visually separate the claims by accident year, by adding a new ruleset to the site’s CSS:

CSS
1
2
3
4
tr.separated td {
    /* set border style for separated rows */
    border-bottom: 2px solid #D8D8D8;
}

Finally, although the above table provides a better description of the book of business, it is not compact, and nor is it in a form that is amenable to reserving calculations. Below is a table that aggregates the transactions by accident year, on an incremental paid basis. Below that, is a similar table, but stated on a cumulative paid basis.

Incremental Paid Claim Triangle
Accident
Year
Incremental Paid Claims as of (months)
12 24 36 48
2005 600 620 300 300
2006 460 460 230
2007 660 660
2008 700

1
2
3
4
5
6
7
8
9
10
11
12
13
14
15
16
17
18
19
20
21
22
23
24
25
26
27
28
29
30
31
32
33
34
35
36
37
<table style="width: 500px">
  <tr>
    <th colspan="5"><strong>Incremental Paid Claim Triangle</strong></th>
  </tr>
  <tr>
    <th rowspan="2"><strong>Accident</br>Year</strong></th>
    <th colspan="4"><strong>Incremental Paid Claims as of (months)</strong></th>
  </tr>
  <tr>
    <th><strong>12</strong></th>
    <th><strong>24</strong></th>
    <th><strong>36</strong></th>
    <th><strong>48</strong></th>
  </tr>
  <tr>
    <td>2005</td>
    <td>600</td>
    <td>620</td>
    <td>300</td>
    <td>300</td>
  </tr>
  <tr>
    <td>2006</td>
    <td>460</td>
    <td>460</td>
    <td>230</td>
  </tr>
  <tr>
    <td>2007</td>
    <td>660</td>
    <td>660</td>
  </tr>
  <tr>
    <td>2008</td>
    <td>700</td>
  </tr>
</table>

Cumulative Paid Claim Triangle
Accident
Year
Cumulative Paid Claims as of (months)
12 24 36 48
2005 600 1,220 1,520 1,820
2006 460 920 1,150
2007 660 1,320
2008 700

1
2
3
4
5
6
7
8
9
10
11
12
13
14
15
16
17
18
19
20
21
22
23
24
25
26
27
28
29
30
31
32
33
34
35
36
37
<table style="width: 500px">
  <tr>
    <th colspan="5"><strong>Cumulative Paid Claim Triangle</strong></th>
  </tr>
  <tr>
    <th rowspan="2"><strong>Accident</br>Year</strong></th>
    <th colspan="4"><strong>Cumulative Paid Claims as of (months)</strong></th>
  </tr>
  <tr>
    <th><strong>12</strong></th>
    <th><strong>24</strong></th>
    <th><strong>36</strong></th>
    <th><strong>48</strong></th>
  </tr>
  <tr>
    <td>2005</td>
    <td>600</td>
    <td>1,220</td>
    <td>1,520</td>
    <td>1,820</td>
  </tr>
  <tr>
    <td>2006</td>
    <td>460</td>
    <td>920</td>
    <td>1,150</td>
  </tr>
  <tr>
    <td>2007</td>
    <td>660</td>
    <td>1,320</td>
  </tr>
  <tr>
    <td>2008</td>
    <td>700</td>
  </tr>
</table>

While I’ve got the visual representation of what I want to achieve here, there’s still quite a bit of work to do. As you can see here, there’s a lot of repetition, and hardcoded redundant values in the code. Indeed, I caught several errors prior to publishing this post. Next, I’ll aim to streamline the production of these tables via JavaScript with the following tasks:

  1. Store claims data as a JSON object
  2. Repetition increases the chance for error – for example, you can see that I’ve repeated several bits of data such as the accident date for many of these claims. It’s better to store them in one location, perhaps as a JSON object.

  3. Write a JavaScript function to read the JSON, construct the tables, and populate the tables
  4. The tables above took a lot of copying and pasting of HTML tags. It would be more efficient, and less error-prone, if I automated the construction of these tables with a function.

Posted in: Uncategorized

No. 128 – Simple JavaScript Charts

10 September, 2018 10:33 PM / Leave a Comment / Gene Dan

Selection_283Selection_283I’ve got a few side projects going on, one of which involves creating a web application for some of the actuarial libraries I’m developing. Since I have a bad habit of quitting projects shortly after I’ve announced them to the public, I’m going to wait until I’ve made some progress on it. In the meantime, I’d like to talk about some of the tools that I’ve had to learn in order to get this done – one of which is JavaScript.

I came across JavaScript a many years ago, back when D3.js came out. Upon seeing D3 for the first time, I was immediately amazed at how beautiful the examples were – so much so, that I decided to learn it myself. However, I found the learning curve to be steep, and it soon became apparent to me that I was going to have to learn a lot if I wanted to get good at it. This meant that I would have to take a step back and learn JavaScript, the language underlying D3. Today, I won’t be talking about D3, but I will go over some of the JavaScript that I’ve learned so far, particularly the flotr2 library.

While the charts that I’m showing you today are simple, constructing them is deceptively challenging. The reason why is that producing high-quality graphics (and later, high-quality dynamic graphics) on the Web requires a large body of prerequisite knowledge, including but not limited to:

  • HTML
  • HTML, or HyperText Markup Language, is a markup language that dictates the logical structure of a web page. The structural components that you see on this web page, such as paragraphs, titles, headers, and links, are dictated by HTML tags.

  • CSS
  • CSS, or Cascading Style Sheets, is a style sheet language that dictates the aesthetic layout of a web page. The stylistic features of this web page, such as fonts, colors, margins, etc., are dictated by CSS rule sets.

  • JavaScript
  • JavaScript is a programming language used to create dynamic web pages that respond to user interaction. You may have seen some websites load different charts depending on what the user does. There’s a high chance they were driven by JavaScript.

  • Artistic Ability
  • Many books have been written on the three subjects above. I have encountered many programmers who have spent hours upon hours reading as many books on HTML, CSS, and JavaScript, only to end up producing horrible-looking charts when they try using something like D3,js. Why do their charts look so terrible, when they possess all of the prerequisite technical knowledge to produce them? One reason why, is that they lack artistic ability. Not only would you need to know three languages, but you also have to be skillful in graphic design. The ability to choose an appropriate color palette, careful selection of margins, and subtle placement of graph elements are required.

  • Domain Knowledge
  • Lastly, if you’re going to present something, you really need to know what you’re talking about. I have spent many years trying to become a subject matter expert in actuarial science. However, this post isn’t about that, but moreso about visual presentation. But still, you should have some substance to your methods, if you want to be able to back up your claims.

    Early in my career, I recall an executive telling me that there are a lot of smart people out there with brilliant ideas, yet they fail because they can’t communicate those ideas clearly and concisely, nor can they persuade anyone.

    Humans can be irrational creatures, and aren’t always persuaded by facts. I’ve taken this advice very seriously, and these days my strategy is to use good visual and oral presentation skills to persuade people – while simultaneously carrying out the technical work behind the scenes to a high level of standard, so that I can back my claims up if examined thoroughly.

Now, you might ask, why should I bother learning all of this stuff when I could have just mocked up a bar chart in PowerPoint, and copy-and-pasted it here? There are many good reasons – first, it would make for a very boring blog post, and second, I have greater ambitions for using these technologies in the development of web applications, and not just a one-off blog post. In a web application, the data underlying the charts are stored in a backend database, and explicitly defining the data transfer routines and parameters of those charts via code enables the automatic loading and rendering of charts – when you have thousands of users, the technical way becomes much more productive. Third, reproducible research is a core tenet of the scientific method. Good code can be self-documenting, and being able to reproduce experiments via the execution of well-maintained code will help you justify and defend whatever it is that you’re trying to prove.

flotr2
flotr2 is a JavaScript library that produces simple charts. I plan to transition to D3 later, but I think it’s a good tool for people who are new to JavaScript. Sadly, the two charts that you see below are the culmination of over 500 pages of reading. 400 of those were on HTML and CSS, which I read way back to produce this website that you see here. The other 100 come from some pieces of JavaScript that I read in a web application development book, and from another book that I’m reading on data visualization with JavaScript.

CSS and JavaScript
The examples below depend on two scripts. One is the same CSS script underlying the webpage, and the other is the flotr2 library, stored in a JavaScript file. I’ve placed both these files on my server, and I’ve linked to them in my web page:

1
2
3
4
5
6
7
8
9
10
11
12
13
14
<!DOCTYPE html>
<html lang="en">
  <head>
<meta charset="utf-8">
   <link rel="stylesheet" type="text/css" href="https://www.genedan.com/js/wp_posts/css/style.css">
<title></title>
  </head>
 
  <body>
 
<div id="chart" style="width:500px;height:300px;"></div>
 
<!--[if lt IE 9]><script="js/excanvas.min.js"</script><![endif]-->
<script src="https://www.genedan.com/js/flotr2.min.js"></script>

The following chart, is generated by the script below it. The data are arbitrary, but you can see here that the parameters corresponding to what you see in the cart, are specified in the code (expense data, title, colors, etc.).

1
2
3
4
5
6
7
8
9
10
11
12
13
14
15
16
17
18
19
20
21
22
23
24
25
26
27
28
29
30
31
32
33
34
35
36
<script>
  window.onload =function() {
    expenses = [[0,35],[1,32],[2,28],[3,31],[4,29],[5,26],[6,22]];
    var years = [
     [0, "2006"],
     [1, "2007"],
     [2, "2008"],
     [3, "2009"],
     [4, "2010"],
     [5, "2011"],
     [6, "2012"],
    ];
    Flotr.draw(document.getElementById("chart"), [expenses], {
     title: "Company Expenses ($M)",
      colors: ["#89AFD2"],
     bars: {
     show: true,
        barWidth: 0.5,
        shadowSize: 0,
        fillOpacity: 1,
        lineWidth: 0
      },
      yaxis: {
          min: 0,
          tickDecimals: 0
      },
      xaxis: {
          ticks: years
      },
      grid: {
          horizontalLines: false,
          verticalLines: false
      }
    });
  };
</script>

Now we can change some things up. Let’s say instead of expenses, we want losses. I’ll do that by changing up the title, variable names, color, and data points:

1
2
3
4
5
6
7
8
9
10
11
12
13
14
15
16
17
18
19
20
21
22
23
24
25
26
27
28
29
30
31
32
33
34
35
36
37
38
39
<script>
window.onload =function() {
  losses = [[0,65],[1,75],[2,55],[3,72],[4,61],[5,70],[6,80]];
  var years = [
   [0, "2006"],
   [1, "2007"],
   [2, "2008"],
   [3, "2009"],
   [4, "2010"],
   [5, "2011"],
   [6, "2012"],
  ];
  Flotr.draw(document.getElementById("chart"), [losses], {
   title: "Company Losses ($M)",
    colors: ["#b80f0a"],
   bars: {
   show: true,
      barWidth: 0.5,
      shadowSize: 0,
      fillOpacity: .65,
      lineWidth: 0
    },
    yaxis: {
        min: 0,
        tickDecimals: 0
    },
    xaxis: {
        ticks: years
    },
    grid: {
        horizontalLines: false,
        verticalLines: false
    }
   });
 
};
 
 
</script>

Posted in: Uncategorized

No. 127: ankisyncd – A Custom Sync Server for Anki 2.1

21 August, 2018 11:05 PM / 14 Comments / Gene Dan

I’ve written about spaced repetition a few times in the past, which is a useful method of study aimed at long-term memory retention. I won’t go over the details here, but if you are curious, you can read over these previous posts.

Over the years, it’s become apparent to me that if I am to continue on my path of lifelong learning and retention, I’d have to find a way to preserve my collection of cards permanently.

This has influenced my choice of software – which is to stick with open source tools as much as possible. Software applications can become outdated and discontinued, and sometimes even the vendor can go bankrupt. In this case, you may end up permanently losing data if the application or code that uses it is never made available to the public.

This risk has led me to desire an open source SRS (Spaced Repetition System) that stores data in an accessible, widely-recognized format. Anki meets these two needs quite well, using a SQLite database to store the cards, and LaTeX to encode mathematical notation. Furthermore, the source code is freely available, so should anything happen to Damien Elmes (the creator of Anki), other users can step in to continue the project.

What’s really nice about Anki is the mobility it has offered me when it comes to studying. Not only do I have Anki installed on my home desktop, but I also have it installed on my phone (AnkiDroid), and my personal laptop. Each of these devices can be synced with a service called AnkiWeb, which is a cloud-based platform that syncs the same collection across devices. This allows me to study anywhere – for example, I can study at home before I go to work, sync the collection with my phone, then study on the bus, sync the collection with my laptop, and then study during my lunch break. This allows me to study at times during which I would otherwise be doing nothing (like commuting), boosting my productivity.

AnkiWeb does however, come with its limitations. It’s proprietary, so if the service shuts down or is discontinued for whatever reason, I may be left scrambling for a replacement. Furthermore, it’s also a free service, so collection sizes are limited to 250 MB (if there were a paid option, I’d gladly pay for more), and having to share the service with other users can slow down data transfer at times of peak usage.

These limitations have led me to use an alternative syncing service. For about a year I used David Snopek’s anki-sync-server, a Python-based tool that allows you to use a personal server as if it were Ankiweb:

The way it works is that the program is installed on a server (this can be your personal desktop), and a copy of the Anki SQLite database storing your collection is also placed on this server. Then, instead of pointing to AnkiWeb, each device on which Anki is installed points to the server. anki-sync-sever then makes use of the Anki sync protocol to sync all the devices, giving you complete control over how your collection is synced.

Unfortunately, the maintainer of the project stopped updating it two years ago, and to make matters worse, I found out in the middle of last year that Damien Elmes planned to release Anki 2.1, porting the code from Python 2 to Python 3, which meant that anki-sync-server would no longer work once the new version of Anki was released. This led me to search for a workaround, which fortunately I found from another github user, tsudoko, called ankisyncd.

tsudoko forked the original anki-sync-server and ported the code from Python 2 to Python 3. Over the development period and beta testing of Anki 2.1, I would periodically check back with both the ankisynced and Anki repos to test whether the two programs were compatible with each other. This was a very difficult task, since it was very hard to install Anki 2.1 from source – doing so required me to install a large number of dependencies on a very modern development platform. Once Anki 2.1 was released, it took me another two days to figure out how to get my server up and running. Because this was so challenging, I decided to write a guide to help anyone who is interested in setting up their own sync server, as well as a reference for myself.

Setting Up the Virtual Machine
I have ankisynced installed on my regular machine, but it’s easy to experiment (and fail) on a virtual machine, so I advise you to do the same. While I was testing ankisynced and Anki 2.1 beta, I used an Ubuntu 18.04 virtual machine on Virtualbox

Installing the Dependencies
Anki 2.1, although already released, is still somewhat challenging to install from source due to the large number of dependencies. Damien’s developer guide helped me a bit on this front. Once you get your virtual machine launched, open up a terminal and install the following packages:

Shell
1
2
sudo apt-get install python3-pip make git mpv lame
sudo pip3 install sip pyqt5==5.9

Your window should look like this:

Next, you’ll need to install pyaudio. I had issues trying to do a pip install, so you may need to install portaudio first. The following code downloads and installs portaudio, and then installs pyaudio:

Shell
1
2
3
4
5
6
7
wget http://portaudio.com/archives/pa_stable_v190600_20161030.tgz
tar -zxvf pa_stable_v190600_20161030.tgz
cd portaudio
./configure && make
sudo make install
sudo ldconfig
sudo pip3 install pyaudio

Clone the GitHub Repositories

Next, you’ll need to clone both the Anki and ankisyncd repositories. What this means is that you’ll simply download the repos into your home directory:

Shell
1
2
3
cd ~
git clone https://github.com/dae/anki
git clone --recursive https://github.com/tsudoko/anki-sync-server


Install More Dependencies

Anki 2.1 requires more dependencies. Fortunately, some are already listed in the repo, so you can just cd into it and install them from there:

Shell
1
2
cd ~/anki
sudo pip3 install -r requirements.txt


Install Anki

Next, we install from source:

Shell
1
2
sudo ./tools/build_ui.sh
sudo make install

Move Modules Into /usr/local
In order to make use of Anki’s sync protocol, the modules need to be picked up by PYTHONPATH. One way to do that is to copy them into /usr/local. In the following code, replace “test” with your ubuntu username:

Shell
1
2
sudo cp -r /home/test/anki-sync-server/anki-bundled/anki /usr/local/lib/python3.6/dist-packages
sudo cp -r /home/test/anki-sync-server/ankisyncd /usr/local/lib/python3.6/dist-packages

Next, start up Anki, and then close it. You’ll need to do this so that the addons folder is created in your home drive.

Configure ankisyncd
You’ll need to install one more dependency, webob:

Shell
1
2
cd ~/anki-sync-server
sudo pip3 install webob

Next, you’ll need to configure the file. Open up ankisyncd.conf in the text editor:

Shell
1
gedit ankisyncd.conf

Replace the host IP with the IP address of your server. You’ll see 127.0.0.1 in the image, but you should replace it with its network IP address (this part might be tricky if you haven’t done it before):

1
2
3
4
5
6
7
8
9
10
[sync_app]
# change to 127.0.0.1 if you don't want the server to be accessible from the internet
host = 127.0.0.1
port = 27701
data_root = ./collections
base_url = /sync/
base_media_url = /msync/
auth_db_path = ./auth.db
# optional, for session persistence between restarts
session_db_path = ./session.dbr

Next, you’ll need to create a username and password. This is what you’ll need to use when syncing with Anki. Replace “test” with your username and enter a password when prompted:

Shell
1
sudo python3 ./ankisyncctl.py adduser test

Now, you’re ready to start ankisyncd:

Shell
1
sudo python3 ./ankisyncd/sync_app.py ankisyncd.conf

If the above command was successful, you should see the following:

This means that the server is now running.

Install Addons on Client Devices

In order to get ankisyncd syncing with your other devices, you’ll need to configure the addons directory on those devices to get Anki to sync with your server. You can also do this with the host machine (which we’ll try here), but you need to repeat this procedure on all your client devices.

On Ubuntu 18.04, this directory is ./local/share/Anki2/addons21/.

Create a folder called ‘ankisyncd’ and within that folder, create a file called __init__.py:

Shell
1
2
3
4
cd ~/.local/share/Anki2/addons21
mkdir ankisyncd
cd ankisyncd
touch __init__.py

On Windows, do the same thing, but in the addons folder for the Windows version of Anki. It will sync, even if the server is running Linux.

Sync
Now, you’re ready to launch Anki. Launch Anki on the host machine or a client device (better to try the host machine first). When you’re ready to sync, click the sync button. A dialogue box will pop up asking for credentials, as if you were logging into AnkiWeb. Enter the credentials that you made during configuration, and the app should sync to your server instead of AnkiWeb.

Syncing with AnkiDroid

To sync with AnkiDroid, go to Settings > Advanced > Custom sync server. Check the “Use custom sync server” box. Enter the following parameters for Sync url and Media sync url:

Sync url
http://127.0.0.1:27701/

Media sync url
http://127.0.0.1:27701/msync

But, replace 127.0.0.1 with the public IP of your host machine.


Ending Remarks

As you can see, the setup is not a trivial task, which is the downside of trying to use ankisyncd. Believe it or not, it was even harder with anki-sync-server!. This is just one out of many examples of what open source enthusiasts have to deal with on a daily basis. However, power users and experienced users like myself get complete control over the sync process. Though the process, I did learn a lot about the installation process (installing from source and not just clicking a button), GitHub, and networking.

Posted in: Uncategorized / Tagged: anki, anki sync, anki-sync-server, ankidroid, ankisyncd, custom sync server

Post Navigation

1 2 3 Next »

Archives

  • September 2023
  • February 2023
  • January 2023
  • October 2022
  • March 2022
  • February 2022
  • December 2021
  • July 2020
  • June 2020
  • May 2020
  • May 2019
  • April 2019
  • November 2018
  • September 2018
  • August 2018
  • December 2017
  • July 2017
  • March 2017
  • November 2016
  • December 2014
  • November 2014
  • October 2014
  • August 2014
  • July 2014
  • June 2014
  • February 2014
  • December 2013
  • October 2013
  • August 2013
  • July 2013
  • June 2013
  • March 2013
  • January 2013
  • November 2012
  • October 2012
  • September 2012
  • August 2012
  • July 2012
  • June 2012
  • May 2012
  • April 2012
  • March 2012
  • February 2012
  • January 2012
  • December 2011
  • September 2011
  • August 2011
  • July 2011
  • June 2011
  • January 2011
  • December 2010
  • October 2010
  • September 2010
  • August 2010
  • June 2010
  • May 2010
  • April 2010
  • March 2010
  • September 2009
  • August 2009
  • May 2009
  • December 2008

Categories

  • Actuarial
  • Cycling
  • Logs
  • Mathematics
  • MIES
  • Music
  • Uncategorized

Links

Cyclingnews
Jason Lee
Knitted Together
Megan Turley
Shama Cycles
Shama Cycles Blog
South Central Collegiate Cycling Conference
Texas Bicycle Racing Association
Texbiker.net
Tiffany Chan
USA Cycling
VeloNews

Texas Cycling

Cameron Lindsay
Jacob Dodson
Ken Day
Texas Cycling
Texas Cycling Blog
Whitney Schultz
© Copyright 2025 - Gene Dan's Blog
Infinity Theme by DesignCoral / WordPress