So a while back I wrote about visualizing networks – well, I’m back at it again and I found a sweet dataset containing the Enron emails. However, that dataset might take a few day’s worth of computing power to process, so in the meantime I’ll be showing a much more manageable dataset containing research partnerships of mathematicians who collaborated with Paul Erdos.
In short, Paul Erdos was a great 20th century mathematician who was famous for his eccentric behavior, prolific publishing, and his copious consumption of amphetamines and caffeine. Today, mathematicians often refer to something called an Erdos number, which indicates one’s closeness to the late mathematician. For example, those who published papers directly collaborating with Erdos himself receive an Erdos number of 1, those who collaborate with mathematicians whose Erdos number is 1, but not Erdos himself are given an Erdos number of 2, and so on.
Downloading the Dataset
You can get the dataset here. It is a simple text file, although it needs to be processed into .gexf xml format in order to be used with gephi.
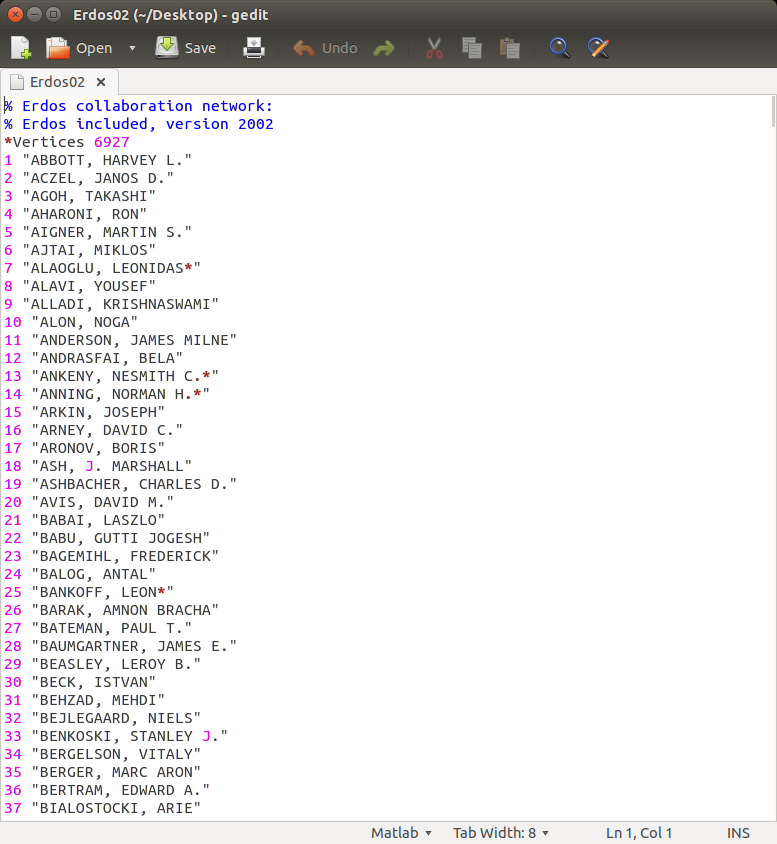
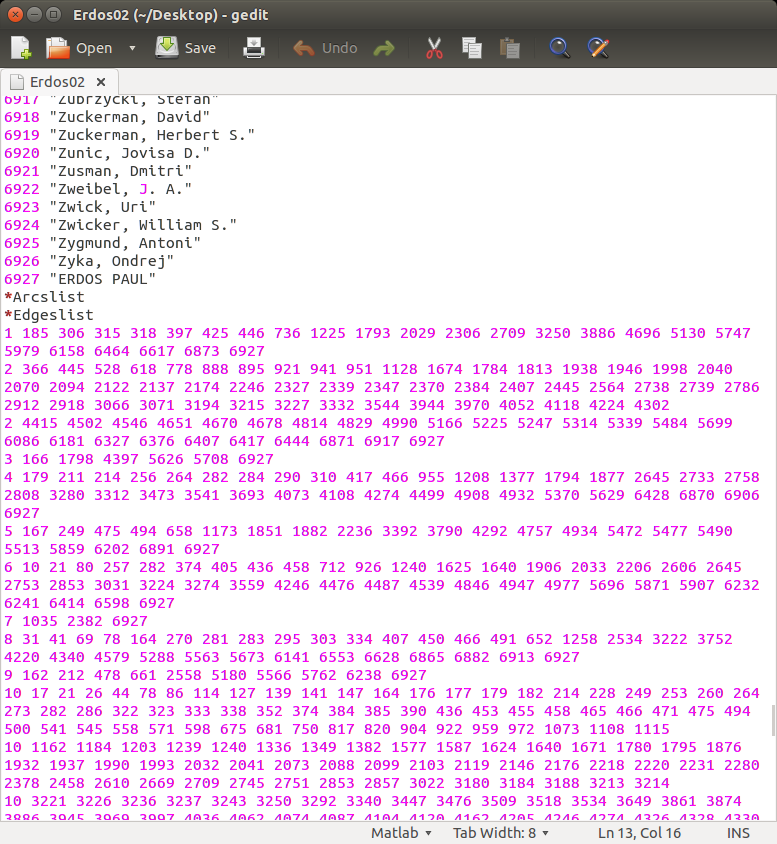
The text file can be divided into two main sections, one containing the node labels, or the names of the mathematicians who collaborated with Erdos. The second section contains the edges, which link one mathematician to the other.
I had to use a script to transform the text file into XML format. I was impatient, so I used Excel. If I were doing a more important project, I would have chosen otherwise.
|
1 2 3 4 5 6 7 8 9 10 11 12 13 14 15 16 17 18 |
Option Explicit Sub create_edges() Dim x, y, z As Long Dim currform, currend, curredge As Long For x = 1 To 507 currform = Range("A1").Offset(x-1, 0).Value y = WorksheetFunction.CountA(Range(x & ":" & x)) - 1 For z = 1 to y currend = Range("A1").Offset(x-1,z).Value Sheets("edges").Range("A1").Offset(curredge-1,0).Value = curredge Sheets("edges").Range("A1").Offset(curredge-1,1).Value = currfrom Sheets("edges").Range("A1").Offset(curredge-1,2).Value = currend Next z Next x End Sub |
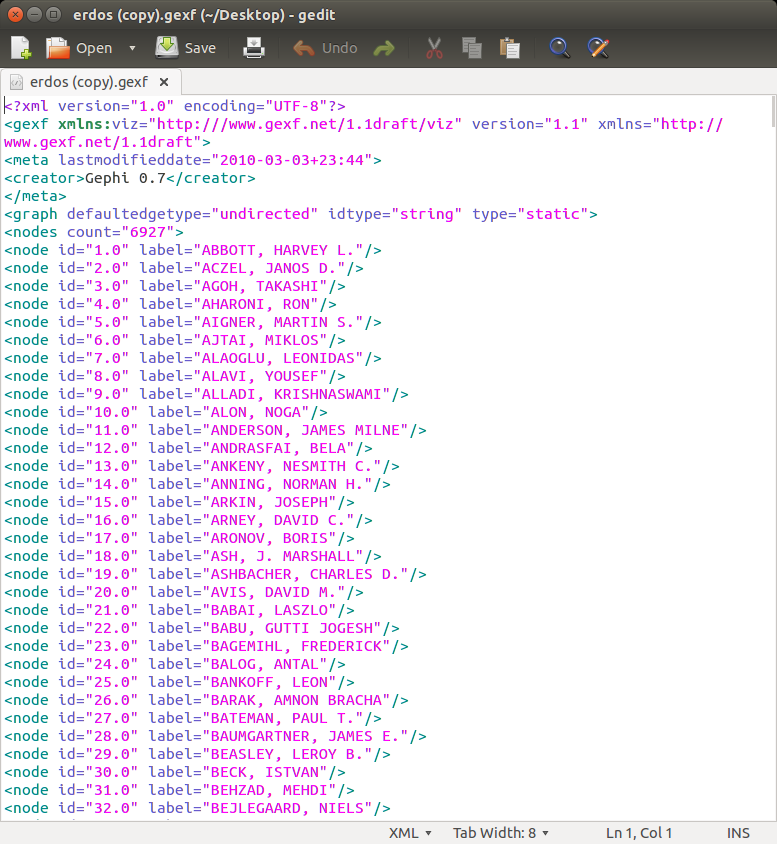
The above image shows the processed data in XML form.
Visualizing the Collaborators
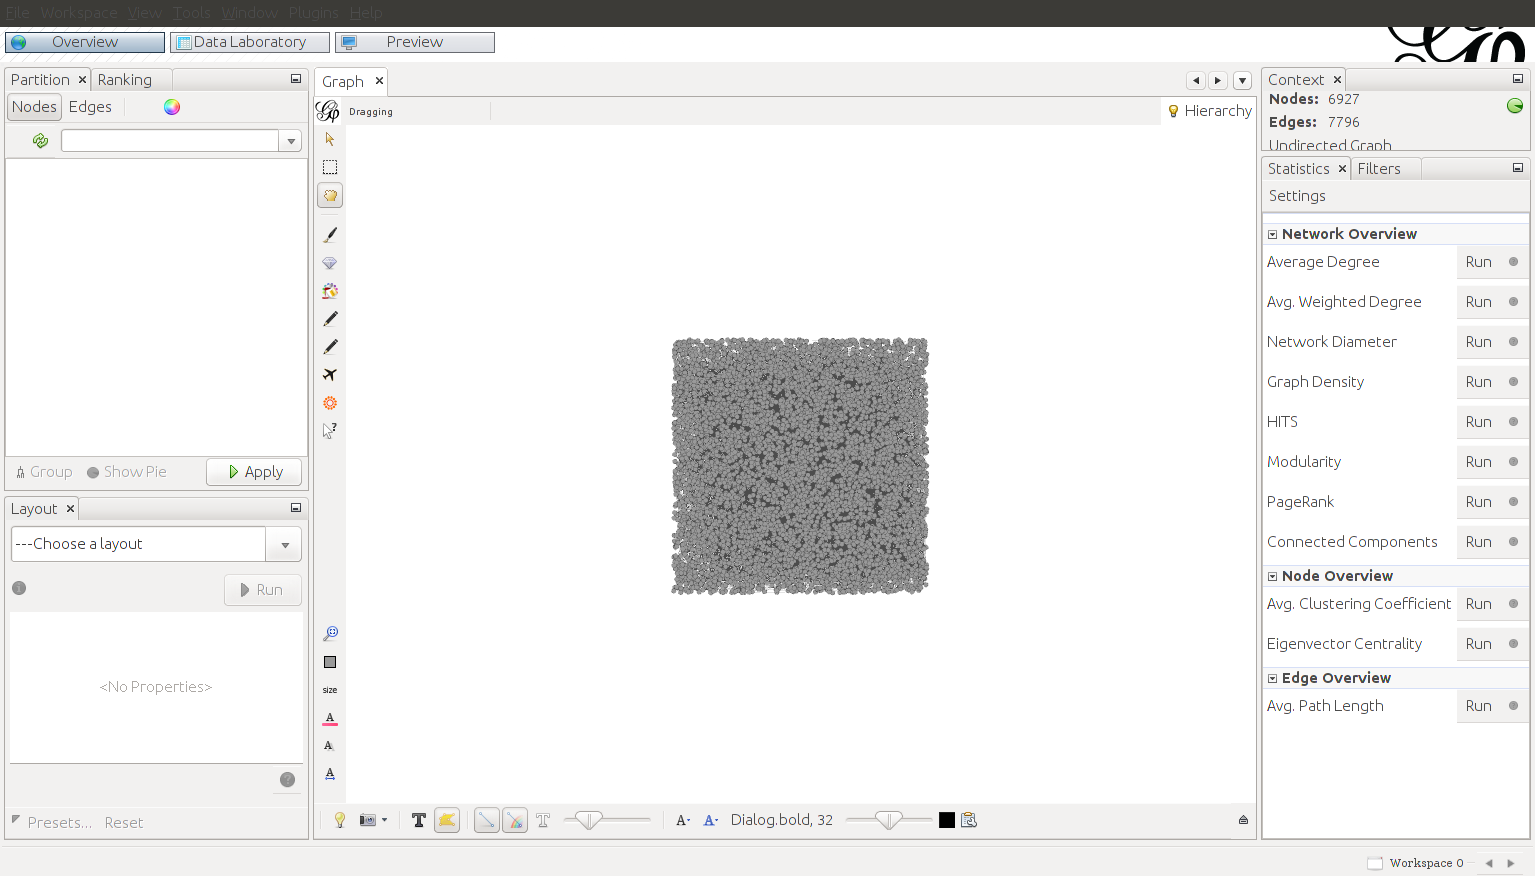
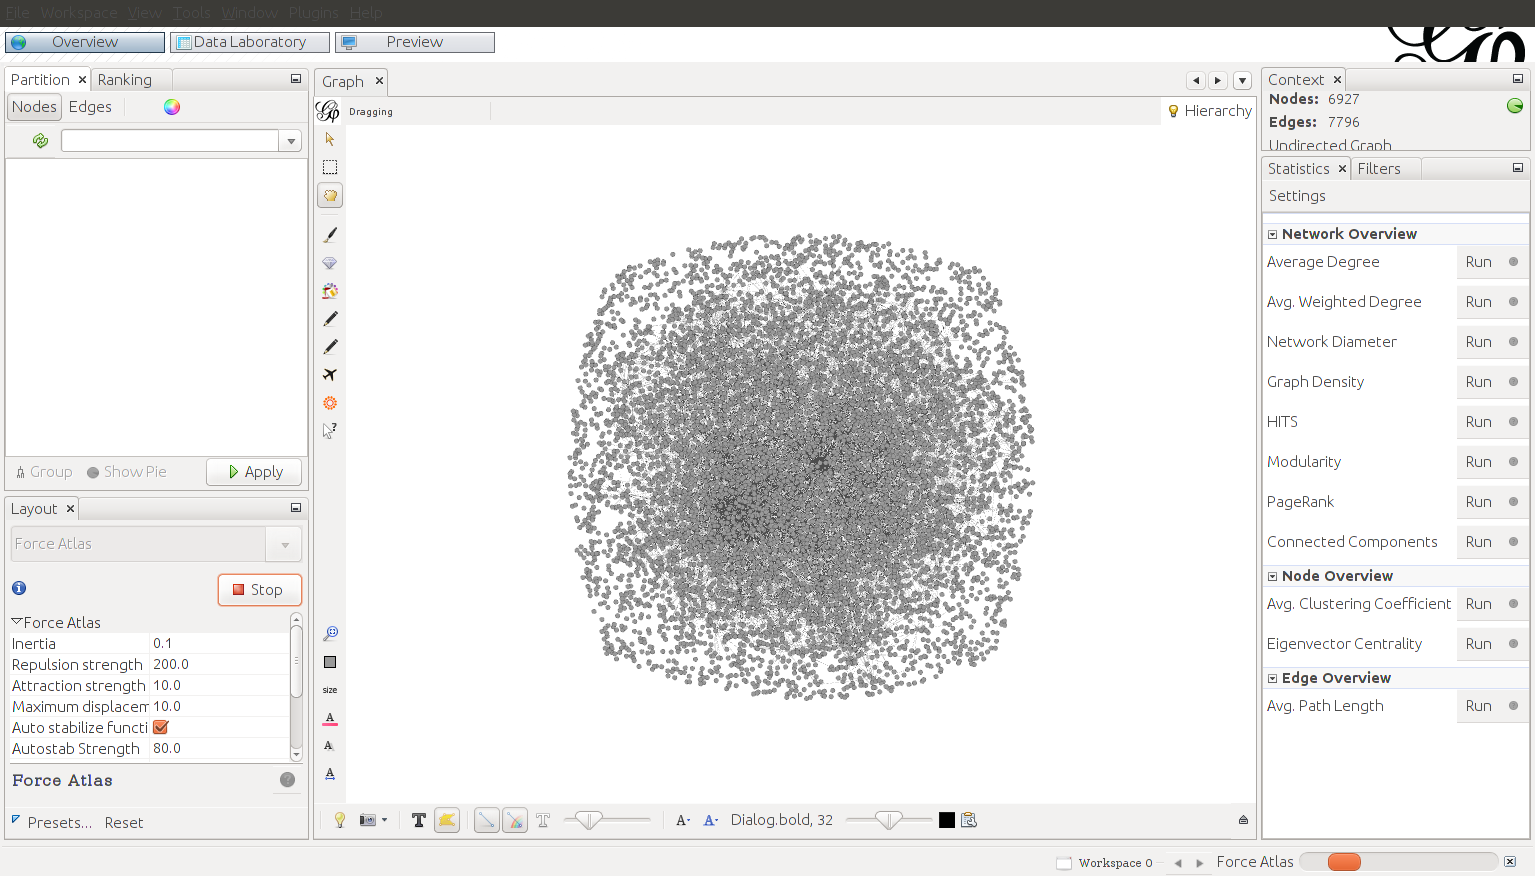
The next step is to import the dataset into gephi. At first, the visual form of the data looks like a meaningless blob:
To remedy this, I used the Force Atlas algorithm to spread the nodes out to visualize the network structure.
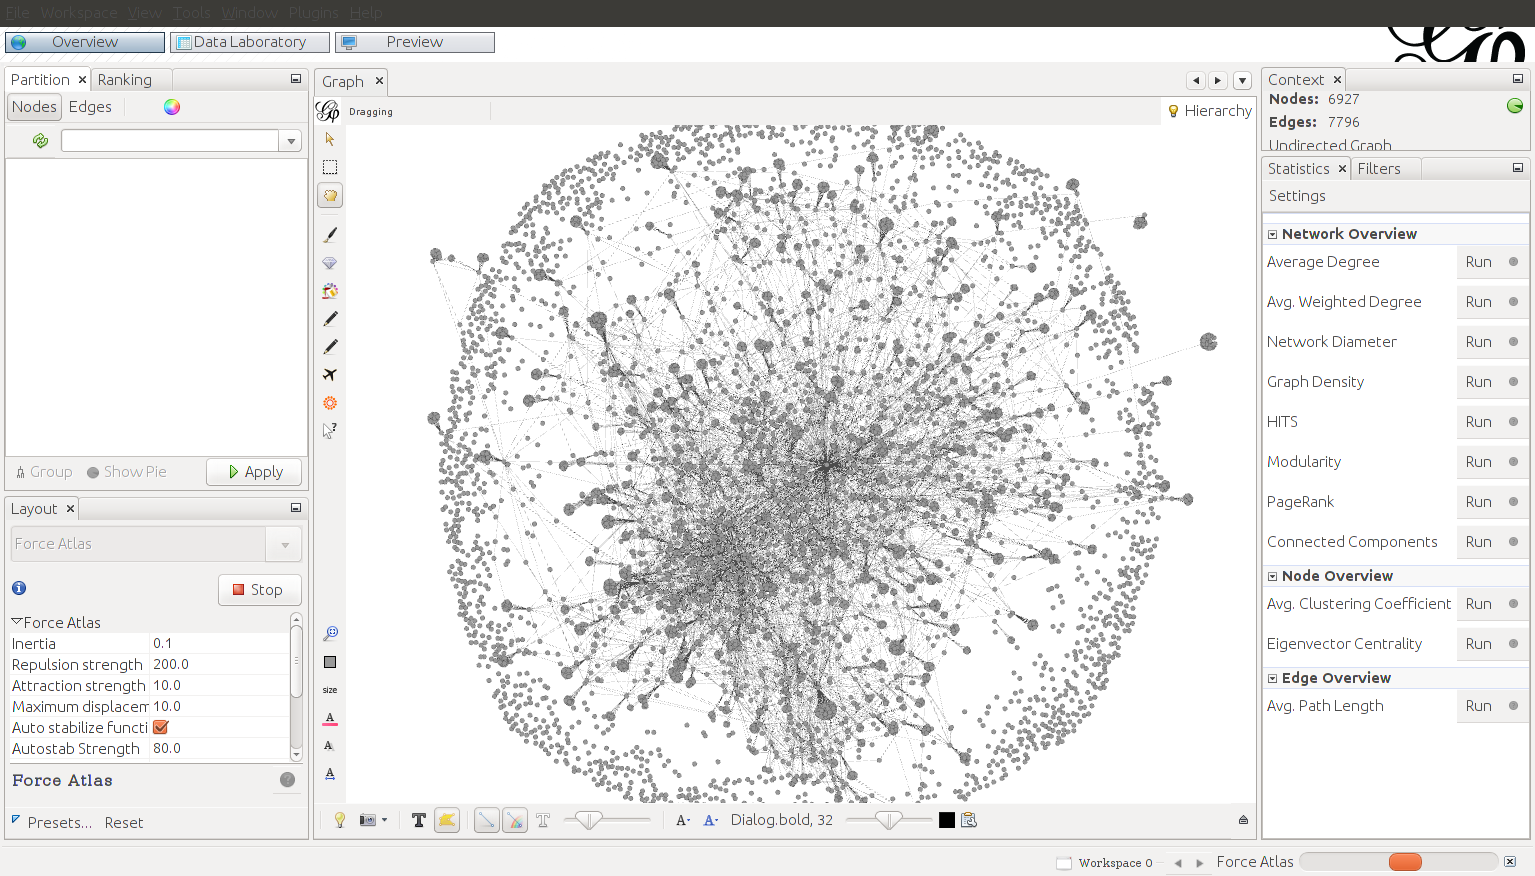
Midway through the Force Atlas Algorithm
Here’s what it looks like after running for half an hour As you can see, the network structure is becoming more apparent:
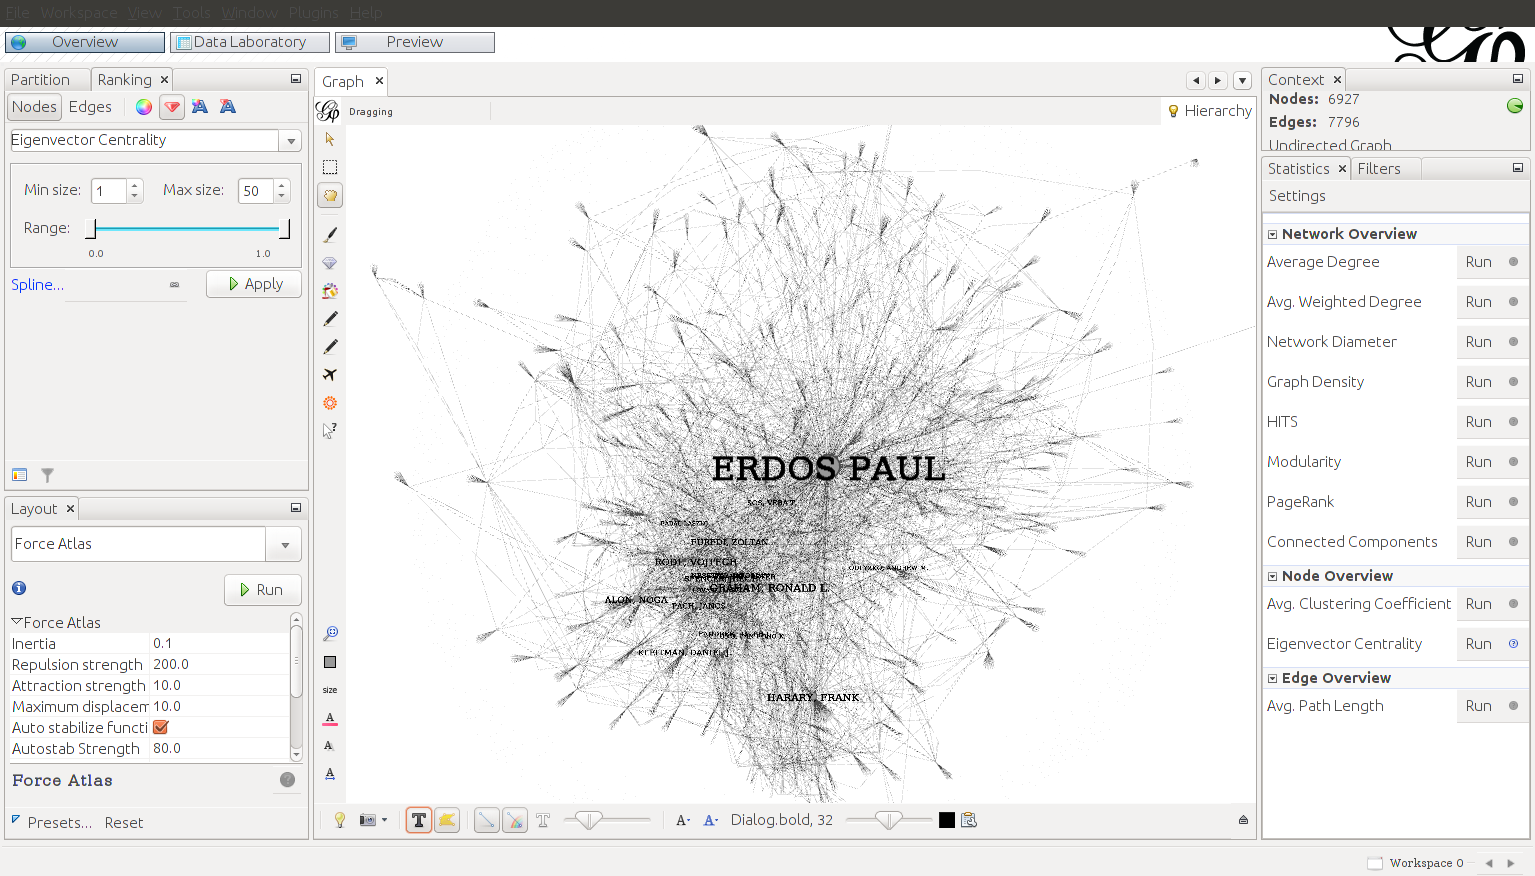
After stopping the Force Atlas algorithm, the network is a little easier to interpret, but the nodes are all the same size. To emphasize the most important nodes, I adjusted the size of the nodes by eigenvector centrality. As you can see, Erdos is the most influential member.
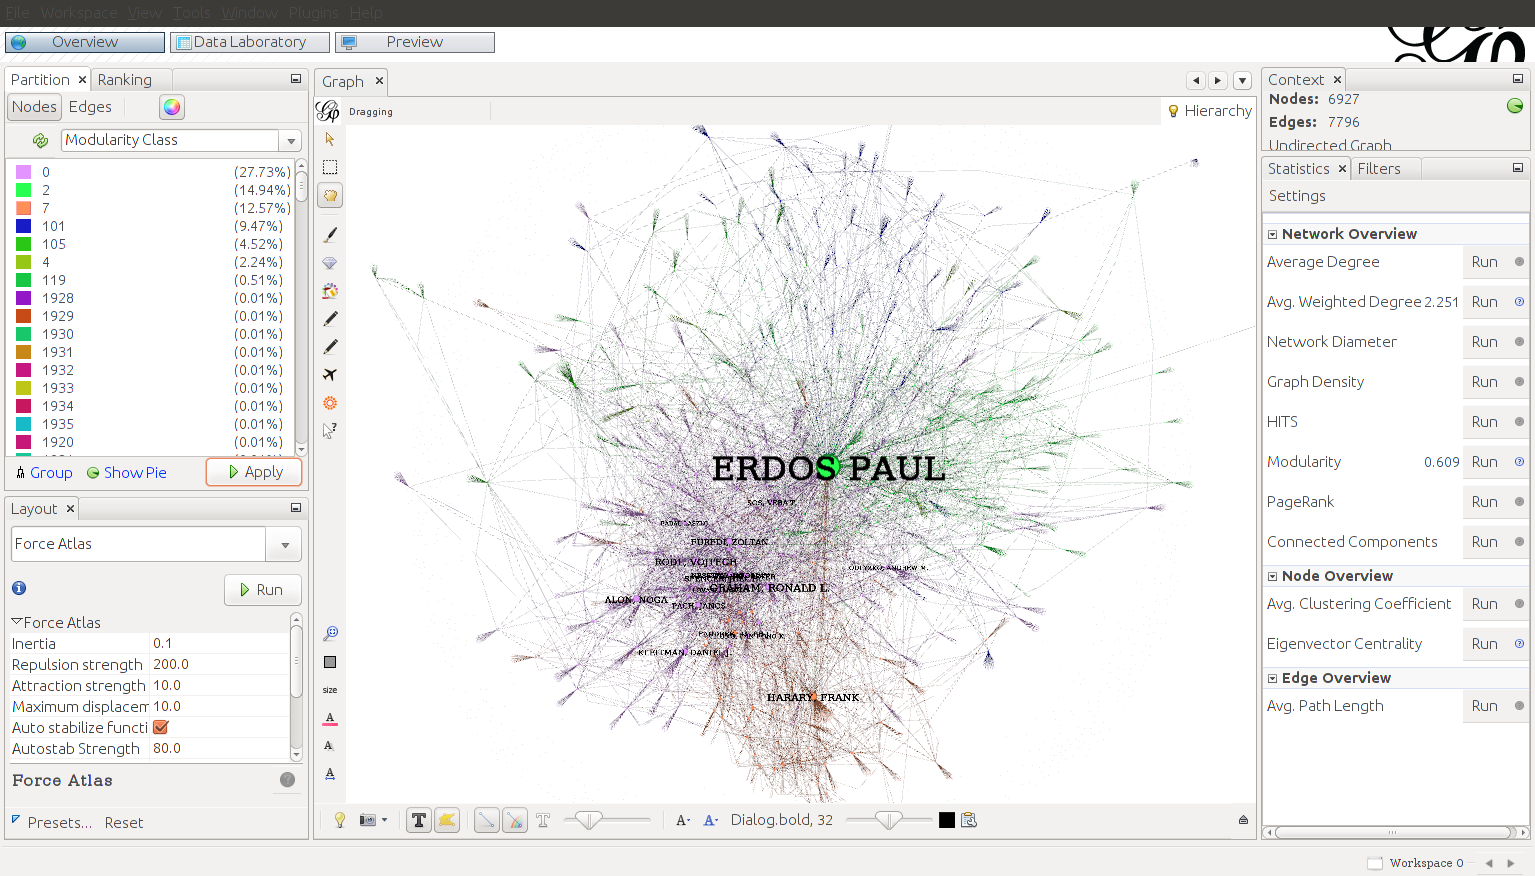
After running a community detection algorithm, we can see several distinct communities of mathematicians amongst the collaborators, indicated by color:
The final output is below. Click to see it in full resolution (it might take a while to render if you try to click on it):
