The Collatz Conjecture is a famous unsolved problem in mathematics. Given any positive integer, if that integer is even, divide it by two. If it’s odd, multiply it by three and then add 1. Keep repeating until you get 1. The conjecture claims that no matter what number you start with, you will always reach 1.
Is this the case? Nobody knows! But let’s try a few examples: 12, 7, and 9
12 -> 6 -> 3 -> 10 -> 5 -> 16 -> 8 -> 4 -> 2 -> 1
7 -> 22 -> 11 -> 34 -> 17 -> 52 -> 26 -> 13 -> 40 -> 20 -> 10 -> 5 -> 16 -> 8 -> 4 -> 2 -> 1
9 -> 28 -> 14 -> 7 -> … 8 -> 4 -> 2 -> 1
In all three cases, we get a chain of numbers that eventually leads to 1. In fact, we can try every integer up to 100 million and we will still end up with 1! Given that a counterexample hasn’t been found for extremely large numbers, many people believe the conjecture to be true. The reason why this problem is so famous is because it’s easy to understand, but hard to solve.
Given the example above, we can construct a directed graph that plots each successive step for all situations up to a specified integer. For example, when n = 50:
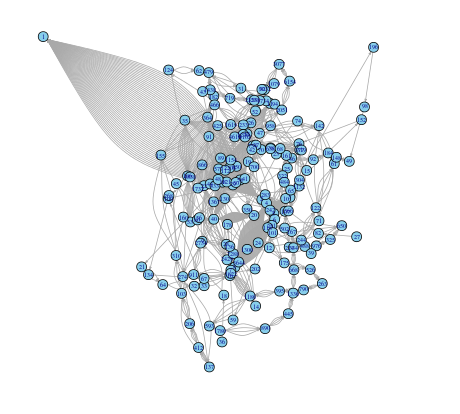
We can see that every chain leads to 1, which is why so many arrows point to node 1. I’ve created a visualization using R Shiny, and using the slider below, you can see how the graph changes as you change n. I could go on about R Shiny, which is an extremely useful package for visualizing mathematical concepts due to its interactive nature, but since I’m busy, I’ll have to save that for a later time.
The code is contained in 3 files, server.R, ui.r, and helpers.R.
server.R:
|
1 2 3 4 5 6 7 8 9 10 11 12 13 14 15 16 17 18 19 20 21 22 23 24 25 26 27 28 29 30 31 |
library(shiny) library(igraph) source("helpers.R") shinyServer(function(input, output) { output$distPlot <- renderPlot({ out.n <- input$n pairs <- c() for(i in 1:out.n) { curr <- i while(curr != 1) { if(curr %% 2 == 0) { nxt <- curr / 2 } else { nxt <- 3 * curr + 1 } pairs <- c(pairs,as.character(curr),as.character(nxt)) curr <- nxt } } graph.directed <- graph(pairs) l <- layout.forceatlas2(graph.directed, iterations=100,plotstep=0) plot(graph.directed,layout=l, vertex.color="skyblue", vertex.size=6, edge.arrow.size=.2, vertex.label.cex=.5) }) }) |
ui.r
|
1 2 3 4 5 6 7 8 9 10 11 12 13 14 15 16 17 18 19 20 21 22 23 24 25 26 27 28 29 30 31 32 33 34 35 36 37 38 39 40 41 42 43 44 45 |
library(shiny) shinyUI(fluidPage( # Application title titlePanel("Collatz Conjecture"), withMathJax( HTML("Consider the following operation on an arbitrary positive integer: <ul> <li>If the number is even, divide it by two.</li> <li>If the number is odd, triple it and add one.</li> </ul></br> In modular arithmetic notation, define the function \\(f\\) as follows:</br> $$f(x)= \\left\\{ \\begin{aligned} \\ n/2 &\\quad \\text{if } n\\equiv0\\,(\\text{mod } 2) \\\\ \\ 3n+1 &\\quad \\text{if } n\\equiv1\\,(\\text{mod } 2) \\\\ \\end{aligned} \\right.$$ Now, form a sequence by performing this operation repeatedly, beginning with any positive integer, and taking the result at each step as the input at the next. In notation: $$a_i=\\left\\{ \\begin{aligned} \\ n & \\quad \\text{for } i = 0 \\\\ \\ f(a_{i-1}) & \\quad \\text{for i} >0 \\\\ \\end{aligned} \\right.$$ The Collatz conjecture is: <i>This process will eventually reach the number 1, regardless of which positive integer is chosen initially</i>.")), # Sidebar with a slider input for K sidebarLayout( sidebarPanel( sliderInput("n", "Directed graph for all sequences up to n:", min = 2, max = 100, value = 50) ), mainPanel( plotOutput("distPlot",width="500px", height="500px") ) ) )) |
The helpers.R file was taken here, and was used to apply the ForceAtlas 2 layout on the igraph package.