I’ve decided to dedicate this month to the study of network theory. For the past few years, I’ve been intrigued not only by the theory’s simplicity – that a graph is simply a collection of nodes and edges, but also its ability to answer seemingly complex and qualitative questions regarding society (both human and nonhuman) in general, such as:
- Who are the most influential members of society?
- What are the most natural subdivisions for identifying communities within a population of people?
- How can we construct a transportation system that optimizes traffic flow and minimizes traffic jams?
- How can small disruptions spread through a network to cause financial crises?
- How can we quantify consensus?
- How are social norms and reputational effects enforced?
- How quickly can a disease spread throughout a community?
…and so on.
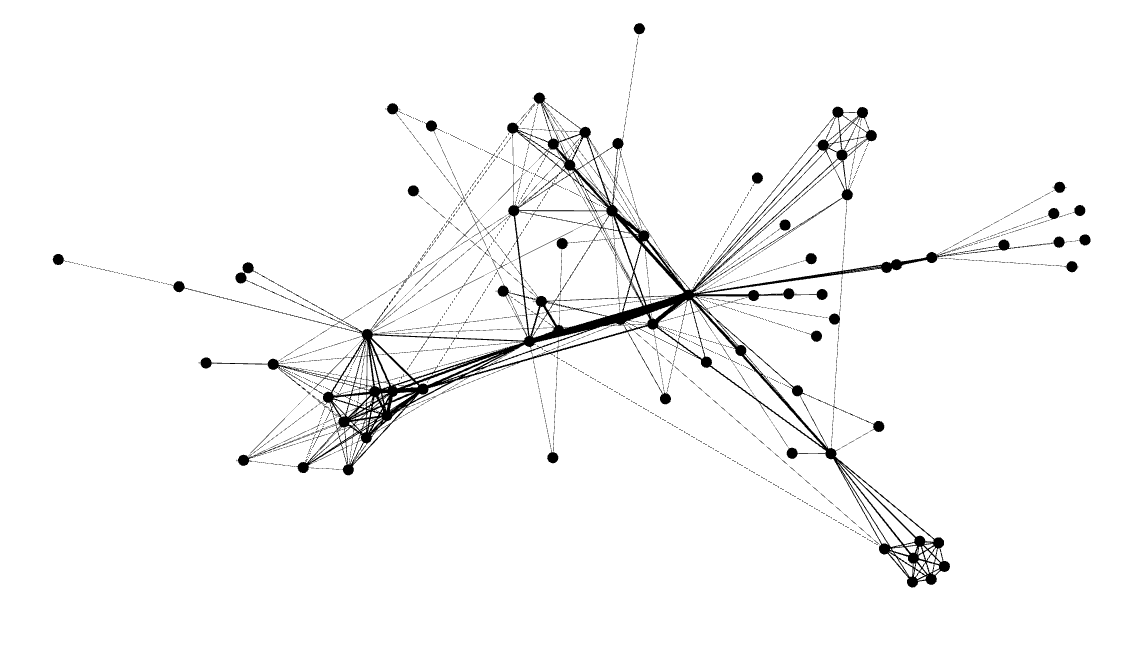
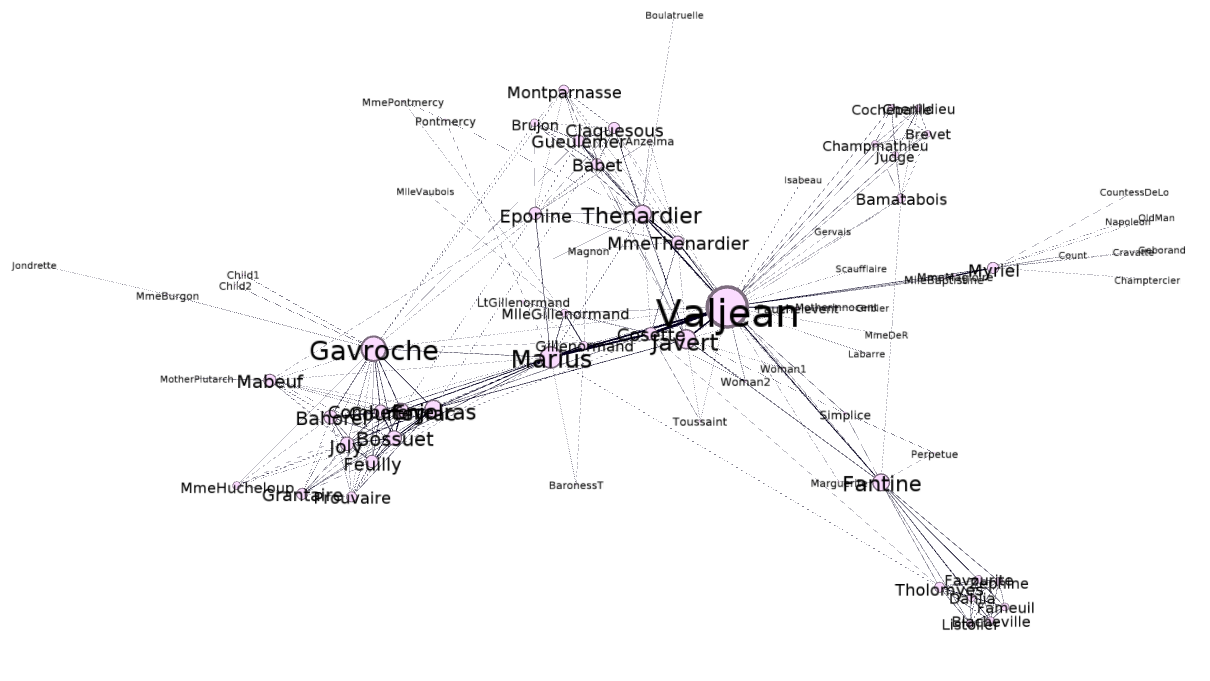
At first glance, the above graph may not look like anything special – but there is indeed something very special about it. This network represents co-occurrences between characters in Victor Hugo’s Les Miserables. After we add some labels to identify the characters, and adjust the size of the nodes and labels to reflect the degree (that is, the number of edges a node participates in), the graph becomes more meaningful in that you can immediately identify the most important characters to the plot:
You can see that the largest node is represents Jean Valjean, the main protagonist of the story. This means that, at least according to degree, Jean Valjean is the most important person in the novel. However, there are several other quantitative measures of influence, and we will later see that Jean Valjean may not be the most influential character in the book, at least according to those other measures.
For this course, I’ll be reading Estrada and Knight’s, A First Course in Network Theory, and I’ll be reading 10 pages per day and applying what I learned there to the Les Miserables network.
There wasn’t much to the first ten pages other than to introduce the history of graph theory (there was a section on the Seven Bridges of Königsberg). So, I’ve used this opportunity to introduce what tools I’ll be using for the course of study. There’s gephi, a graph visualization program, igraph, a package that I’ll be using to perform more quantitative analyses on this network in R, and the Les Miserables network dataset itself.
