There are various layouts that you can choose from to visualize a network. All of the networks that you have seen so far have been drawn with a force-directed layout. However, one weakness that you may have noticed is that as the number of nodes and edges grows, the appearance of the graph looks more and more like a hairball such that there’s so much clutter that you can’t identify any meaningful patterns.
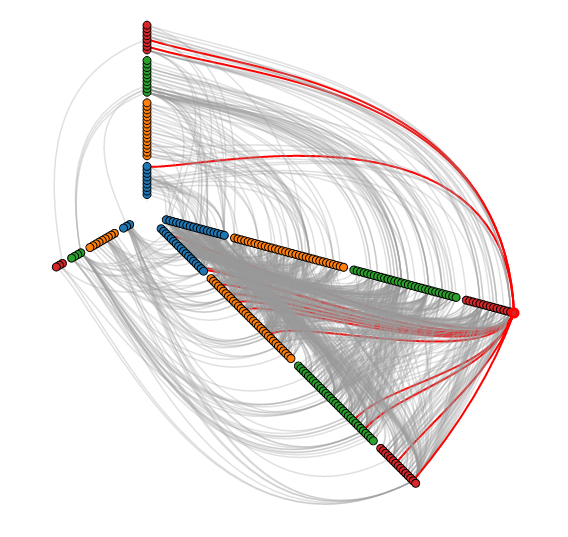
Academics are actively developing various types of layouts for large networks. One idea is to simply sample a subset of the network, but by doing so, you lose information. Another idea is to use a layout called a hive layout, which positions the nodes from the same class on linear axes and then draws the connections between them. You can read more about it here. By doing so, you’ll be able to find patterns that you wouldn’t if you were using a force layout. Below, I’ve taken a template from the D3.js website and adapted it to the petroleum trade network that we’ve seen in the previous posts:
Nodes of the same color belong to the same modularity class, which was calculated using gephi. You can see that similar nodes are grouped closer together and that the connections are denser between nodes of the same modularity class than they are between modularity classes. You can mouse over the nodes and edges to see which country each nodes represent and which countries each trade link connects. Each edge represents money flowing into a country. So United States -> Saudi Arabia means the US is importing petroleum.
For comparison, below is the same network, but drawn with a force-directed layout, which looks like a giant…hairball…sort of thing.
Here’s the code used to produce the json file:
|
1 2 3 4 5 6 7 8 9 10 11 12 13 14 15 16 17 18 19 20 21 22 23 24 25 26 27 28 29 30 31 32 33 34 35 36 37 38 39 40 41 42 43 44 45 46 47 48 49 50 51 52 53 54 55 56 57 58 59 60 61 62 63 64 65 66 67 68 69 70 71 72 73 74 75 76 77 78 |
library(sqldf) #source urls for datafiles trade_url <- "http://atlas.media.mit.edu/static/db/raw/year_origin_destination_hs07_6.tsv.bz2" countries_url <- "http://atlas.media.mit.edu/static/db/raw/country_names.tsv.bz2" #extract filenames from urls trade_filename <- basename(trade_url) countries_filename <- basename(countries_url) #download data download.file(trade_url,destfile=trade_filename) download.file(countries_url,destfile=countries_filename) #import data into R trade <- read.table(file = trade_filename, sep = '\t', header = TRUE) country_names <- read.table(file = countries_filename, sep = '\t', header = TRUE) #extract petroleum trade activity from 2014 petro_data <- trade[trade$year==2014 & trade$hs07==270900,] #we want just the exports to avoid double counting petr_exp <- petro_data[petro_data$export_val != "NULL",] #xxb doesn't seem to be a country, remove it petr_exp <- petr_exp[petr_exp$origin != "xxb" & petr_exp$dest != "xxb",] #convert export value to numeric petr_exp$export_val <- as.numeric(petr_exp$export_val) #take the log of the export value to use as edge weight petr_exp$export_log <- log(petr_exp$export_val) petr_exp$origin <- as.character(petr_exp$origin) petr_exp$dest <- as.character(petr_exp$dest) petr_exp <- sqldf("SELECT p.*, c.modularity_class as modularity_class_dest, d.modularity_class as modularity_class_orig, n.name as orig_name, o.name as dest_name FROM petr_exp p LEFT JOIN petr_class c ON p.dest = c.id LEFT JOIN petr_class d ON p.origin = d.id LEFT JOIN country_names n ON p.origin = n.id_3char LEFT JOIN country_names o ON p.dest = o.id_3char") petr_exp$orig_name <- gsub(" ","",petr_exp$orig_name, fixed=TRUE) petr_exp$dest_name <-gsub(" ","",petr_exp$dest_name, fixed=TRUE) petr_exp$orig_name <- gsub("'","",petr_exp$orig_name, fixed=TRUE) petr_exp$dest_name <-gsub("'","",petr_exp$dest_name, fixed=TRUE) petr_exp <- petr_exp[order(petr_exp$modularity_class_dest,petr_exp$dest_name),] petr_exp$namestr_dest <- paste('Petro.Class',petr_exp$modularity_class_dest,'.',petr_exp$dest_name,sep="") petr_exp$namestr_orig <- paste('Petro.Class',petr_exp$modularity_class_orig,'.',petr_exp$orig_name,sep="") petr_names <- sort(unique(c(petr_exp$namestr_dest,petr_exp$namestr_orig))) jsonstr <- '[' for(i in 1:length(petr_names)){ curr_country <- petr_exp[petr_exp$namestr_dest==petr_names[i],] jsonstr <- paste(jsonstr,'\n{"name":"',petr_names[i],'","size":1000,"imports":[',sep="") if(nrow(curr_country)==0){ jsonstr <- jsonstr } else { for(j in 1:nrow(curr_country)){ jsonstr <- paste(jsonstr,'"',curr_country$namestr_orig[j],'"',sep="") if(j != nrow(curr_country)){jsonstr <- paste(jsonstr,',',sep="")} } } jsonstr <- paste(jsonstr,']}',sep="") if(i != length(petr_names)){jsonstr <- paste(jsonstr,',',sep="")} } jsonstr <- paste(jsonstr,'\n]',sep="") fileConn <- file("exp_hive.json") writeLines(jsonstr, fileConn) close(fileConn) |
 There are various layouts that you can choose from to visualize a network. All of the networks that you have seen so far have been drawn with a force-directed layout. However, one weakness that you may have noticed is that as the number of nodes and edges grows, the appearance of the graph looks more and more like a hairball such that there’s so much clutter that you can’t identify any meaningful patterns.