The release of FASLR v.0.0.3 brings about two significant changes:
- Adding a data import wizard
- Upgrading from PyQt5 to PyQt6
For those new to FASLR, it stands for Free Actuarial System for Loss Reserving, a graphical user interface for the Python chainladder package, both of which are hosted on the Casualty Actuarial Society’s GitHub page. Working on the import wizard has so far, been one of the most enjoyable parts of developing FASLR, not only because I had never imagined myself ever making something like this in my programming journey, but also because my increasing command over the PyQt6 system has allowed me to put the ideas I have visualized in my head onto the computer screen.
Importing Data
Until now, there hasn’t been a way to load external data into FASLR, besides altering the source code to make that happen. Most of what you see in my previous posts on FASLR are examples that can be found in the repo’s demos folder, and illustrate some of program’s existing features on dummy data from actuarial papers. Actually, there still isn’t a way for the user to get data into FASLR, as this post is about the Import Wizard, and not about what happens to the data after you press the ‘OK’ button – that will have to wait for another time.
Anyway, the lack of any kind of import functionality prompted me to begin working on it. Ideally, in-house reserving systems ought to be connected to the company’s loss database, and data should be automatically fed into the system at regular intervals (monthly, quarterly, etc.), negating the need for a manual import wizard to get data into the program. That’s rarely the case however, and even departments that are pretty good at automating that kind of thing will still have the need for their employees to manually insert data in the situations where such automation falls short – such as copying and pasting numbers from Excel or uploading external CSV files. Thus, I decided some kind of import wizard was necessary.
Basic Layout
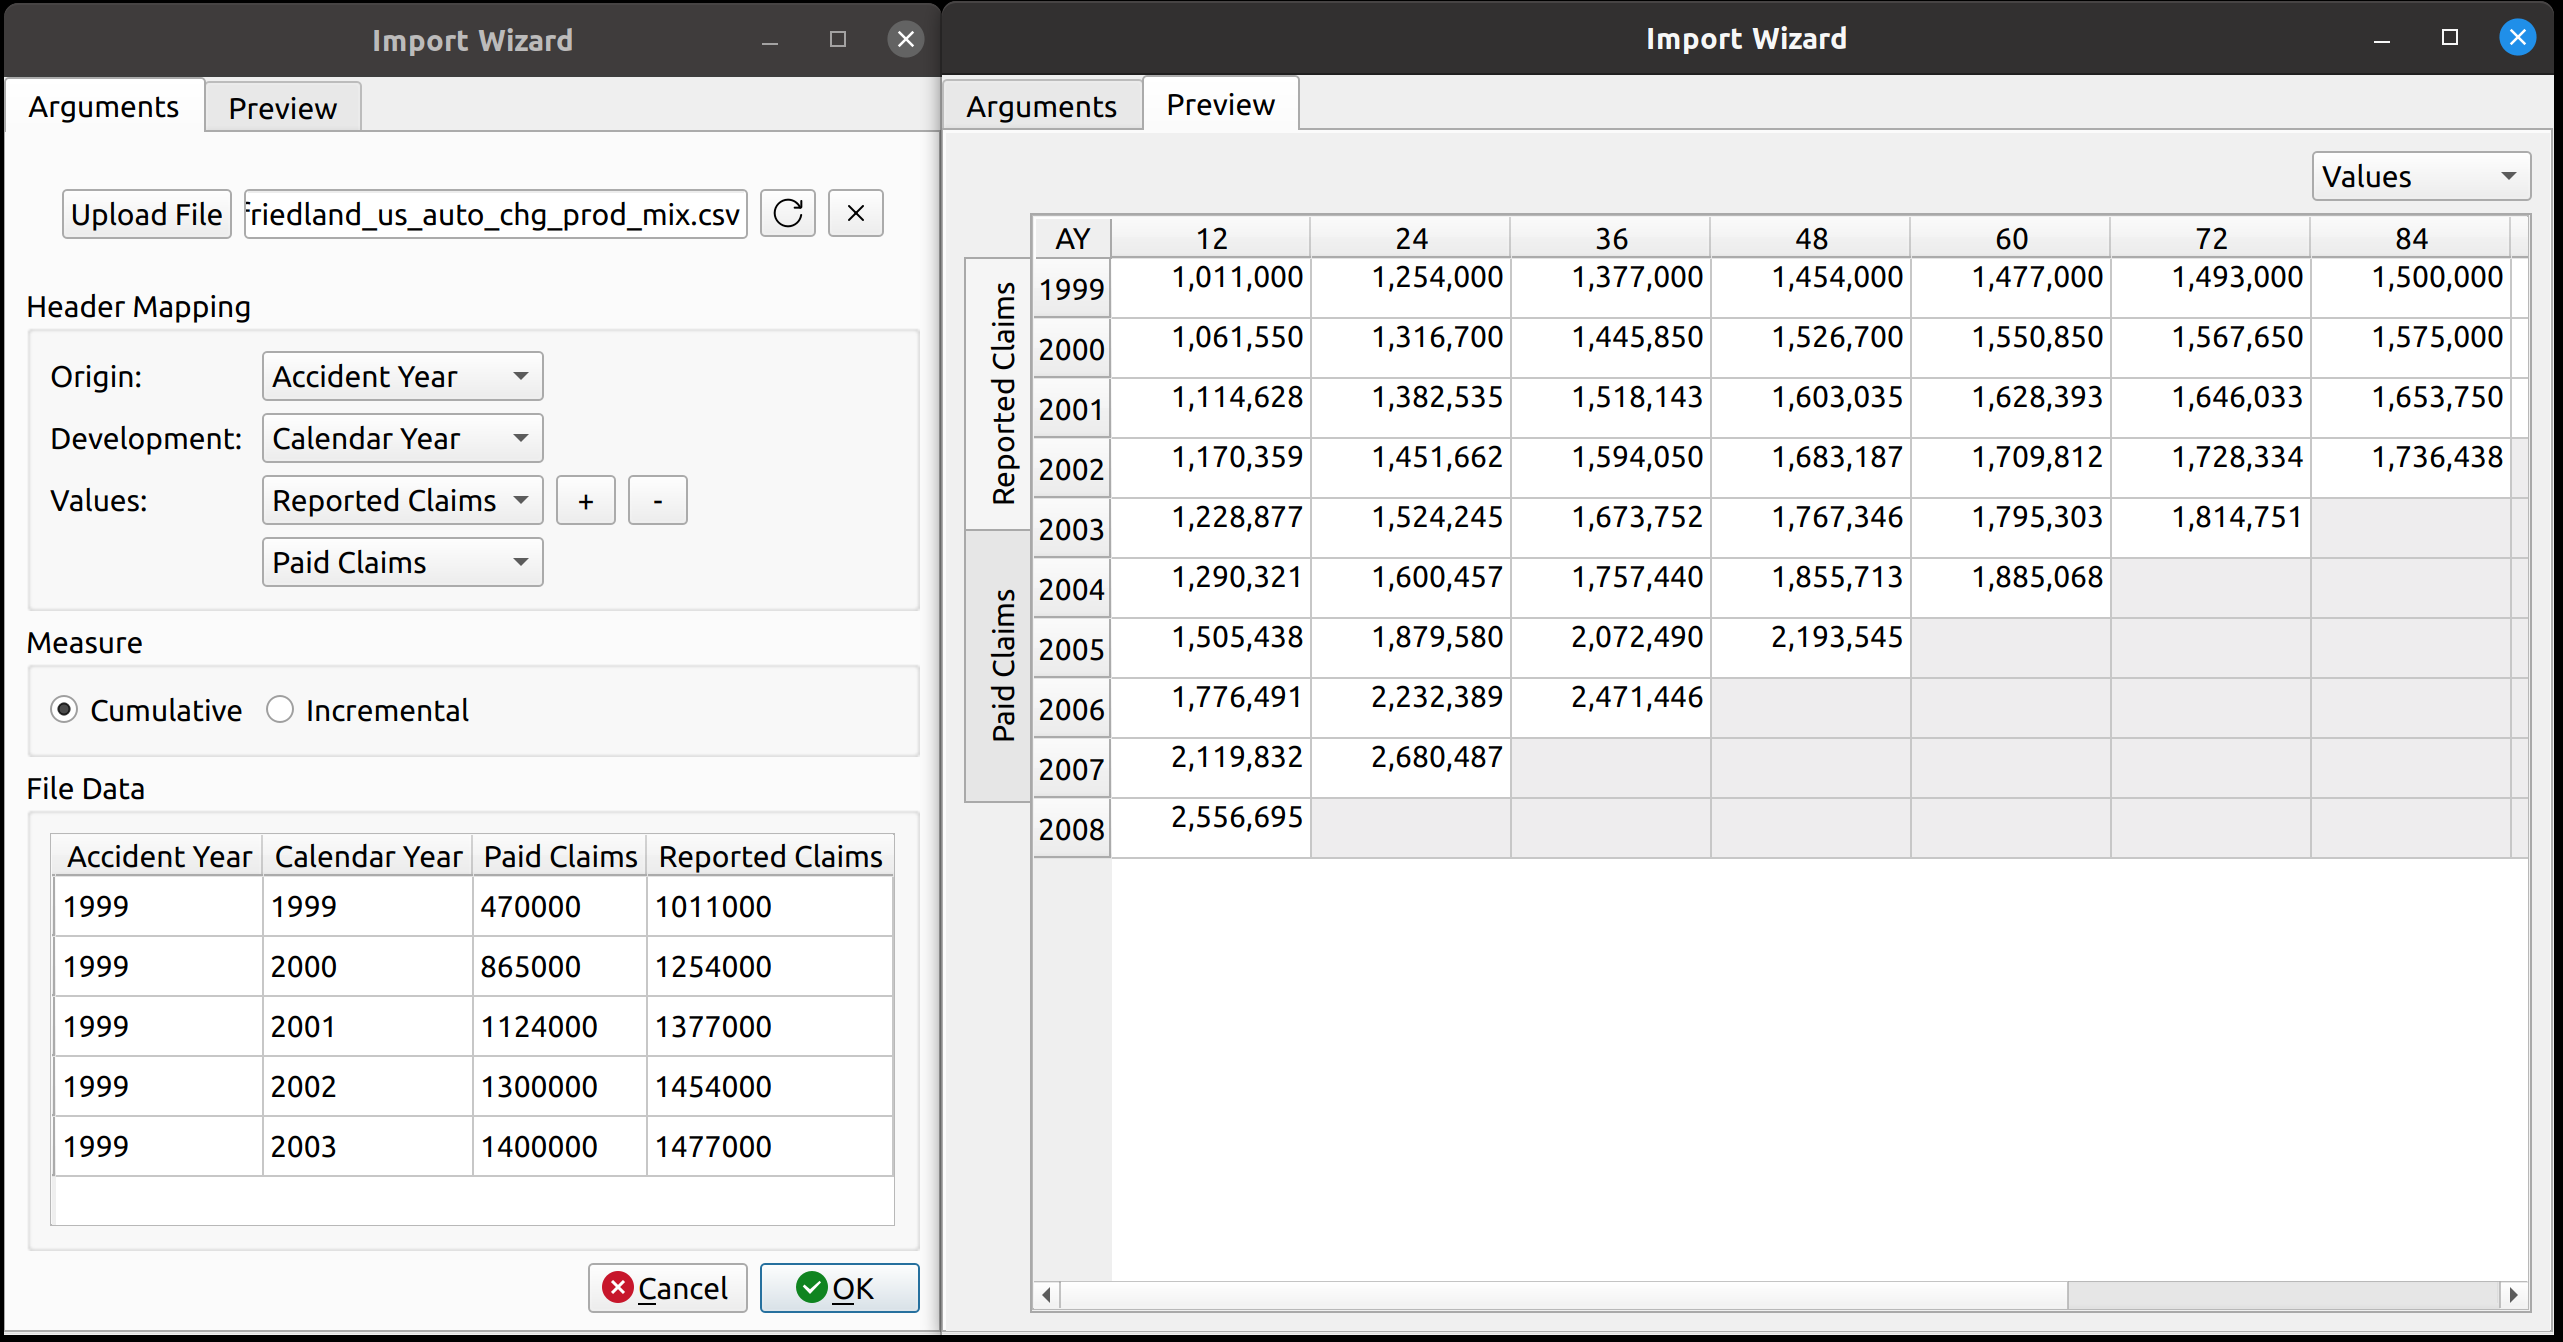
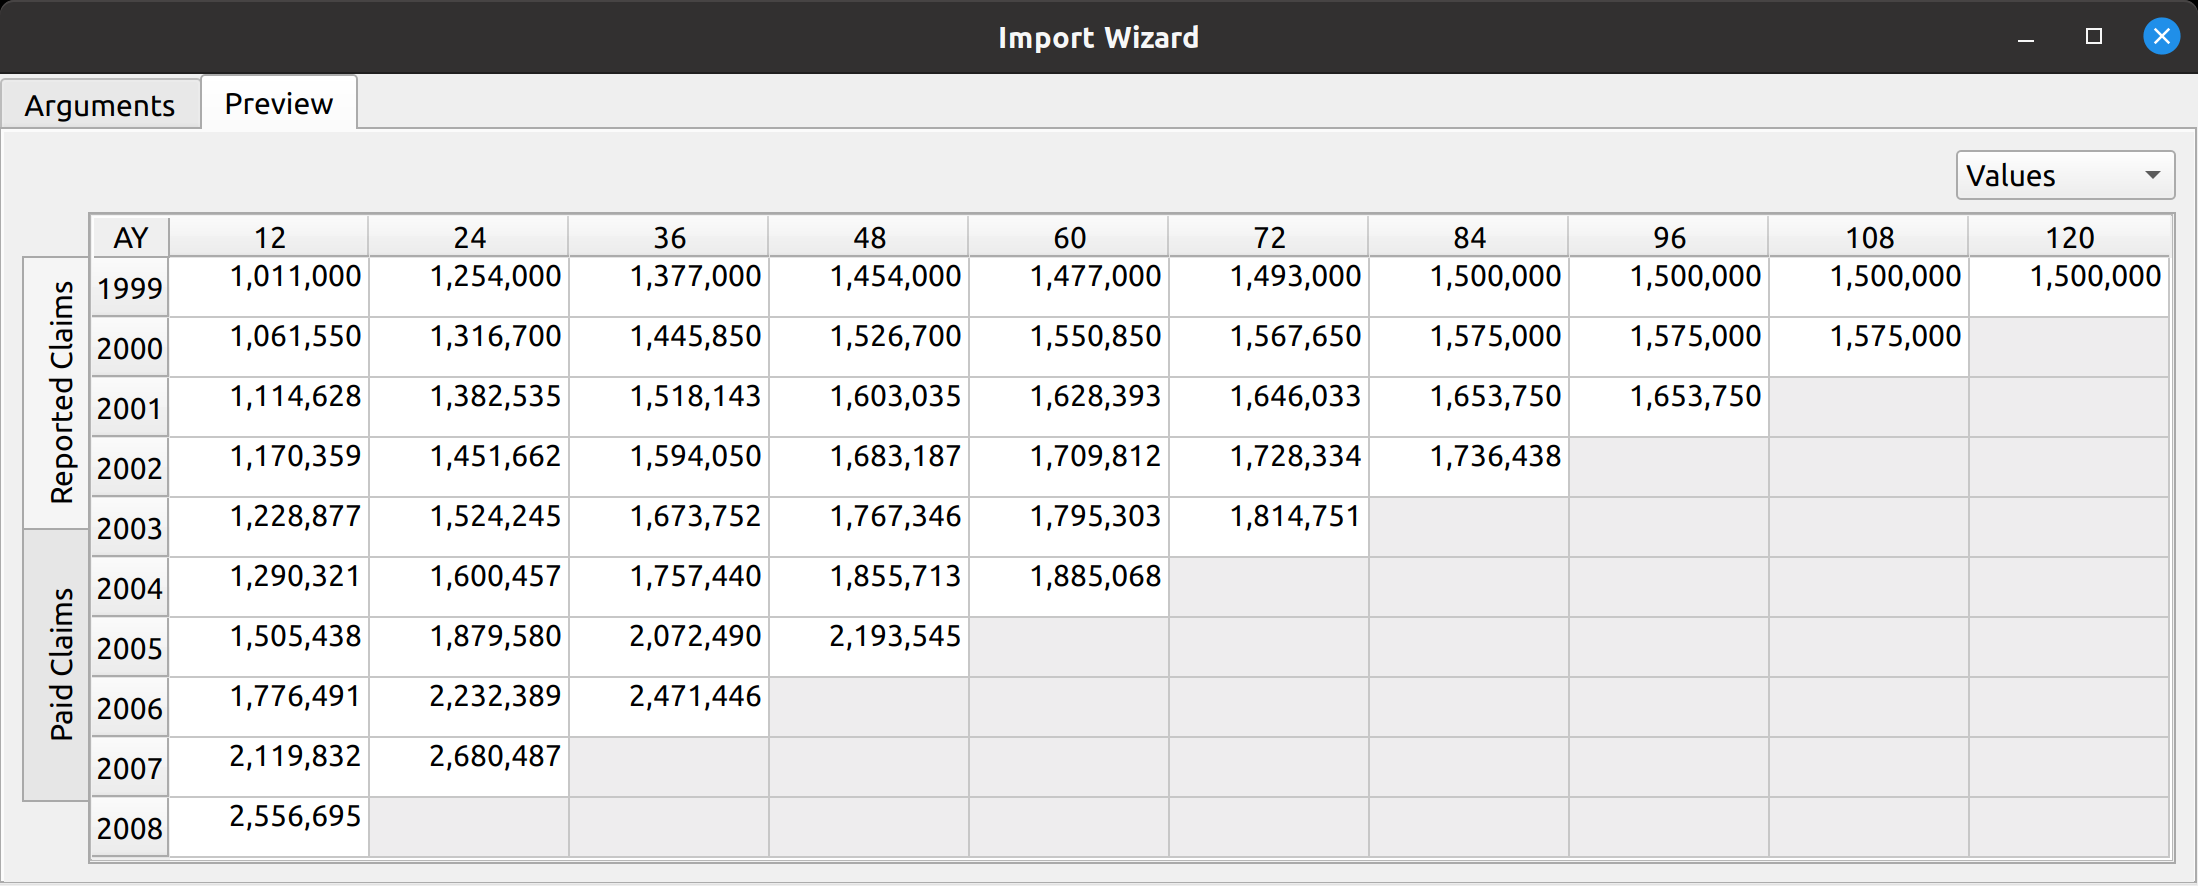
The import wizard has two tabs – one for mapping the external data to its internal FASLR representation, and another to preview the resulting triangle prior to upload. These are labeled “Arguments” and “Preview”, respectively.
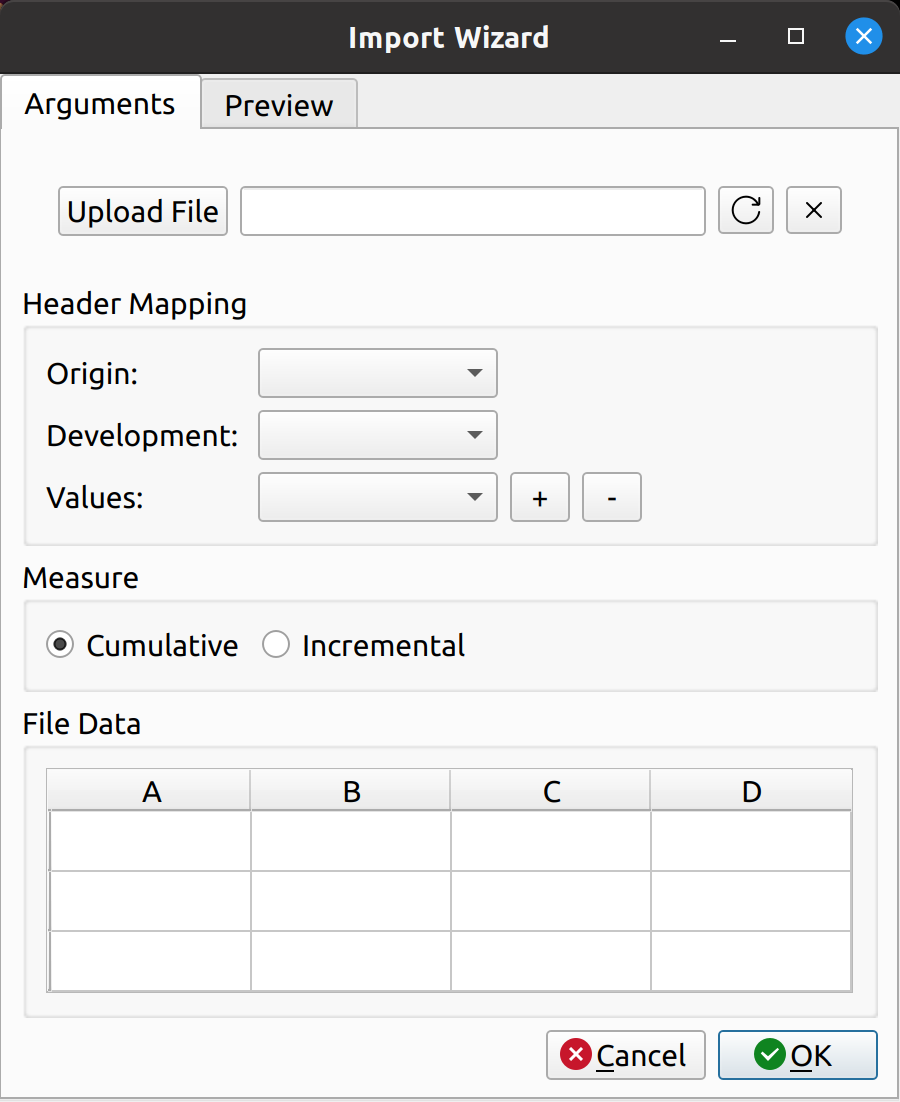
The arguments tab has four main sections:
- File Upload
- Header Mapping
- Measure
- File Data
The file upload section lets you select a CSV file for import. It has an upload button to the left, a text box in the middle to hold the file path, and two buttons to the right to cancel and refresh the form.
The header mapping section is what allows the user to map the CSV fields, say, “Paid Losses” and “Accident Year” to the triangle fields used by FASLR.
The measure section just indicates whether the triangle should be cumulative or incremental. Most triangles encountered by actuaries are cumulative, so I’ve made that the default. I agonized over what to call this section, since I don’t think there’s a commonly accepted word that actuaries use to describe whether a triangle is cumulative or incremental. “Cumulativeness” or “incrementalness” just sounds weird, so I called the section “measure”, which is subject to change if I or someone else finds something better.
The file data section lets the user view the data in the CSV file, to assist them with mapping the fields.
Uploading Files
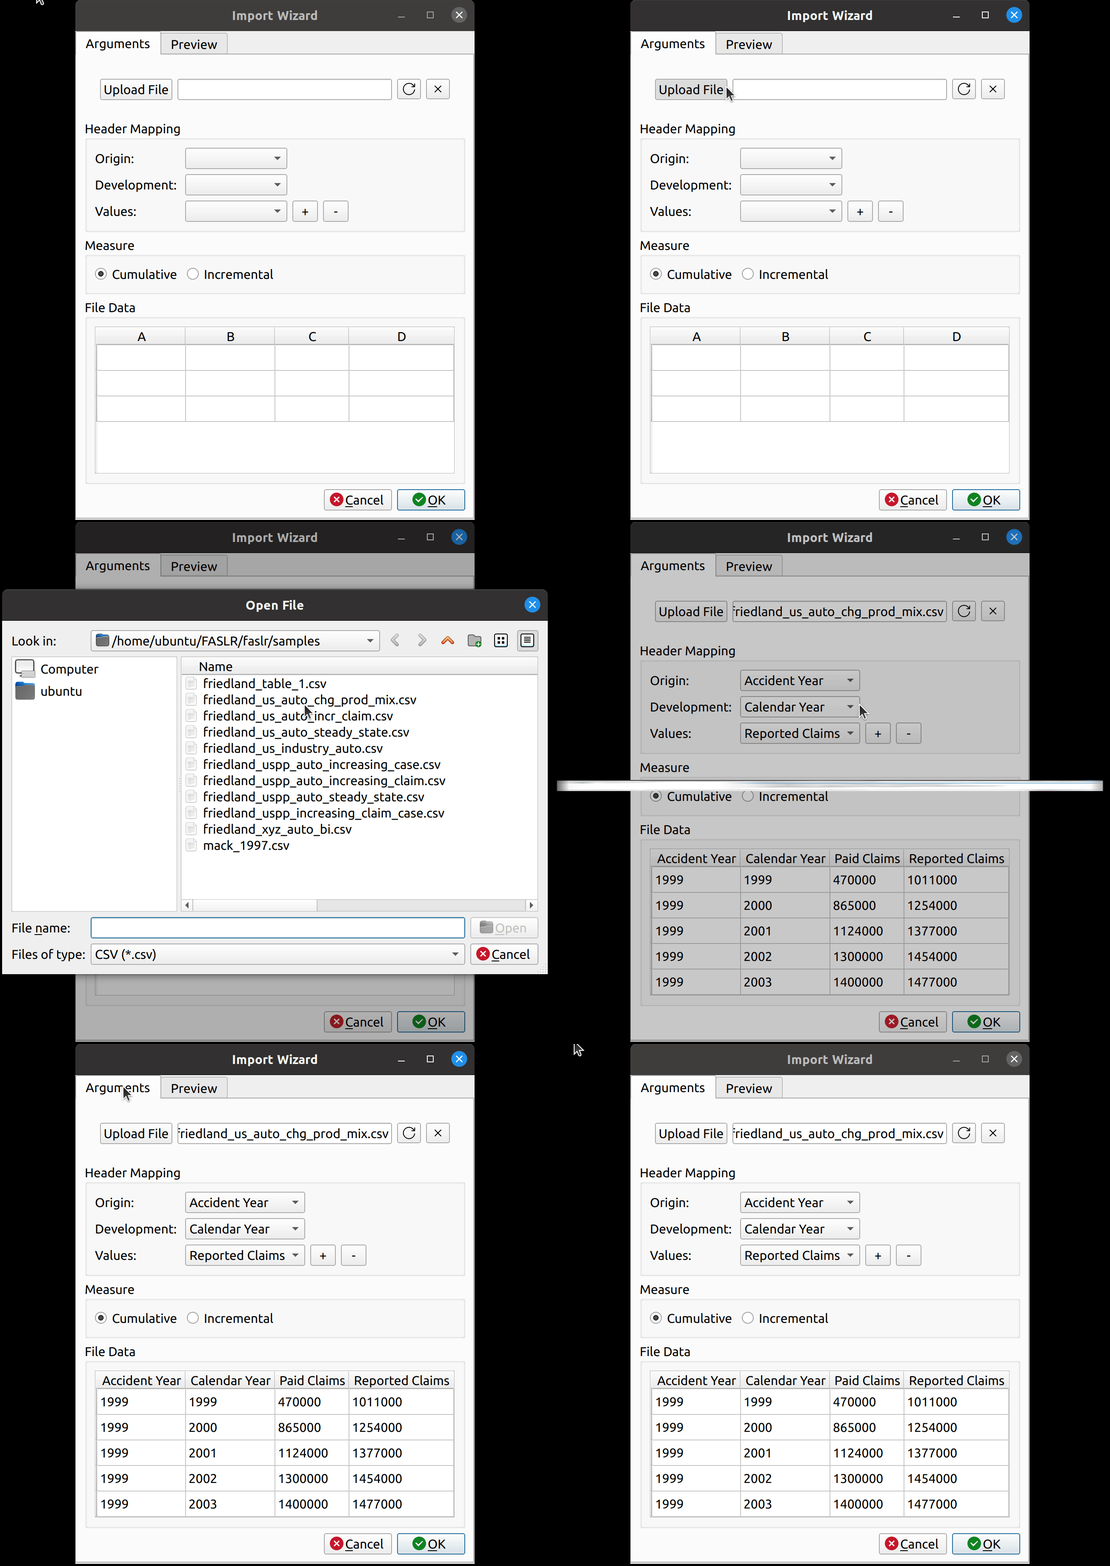
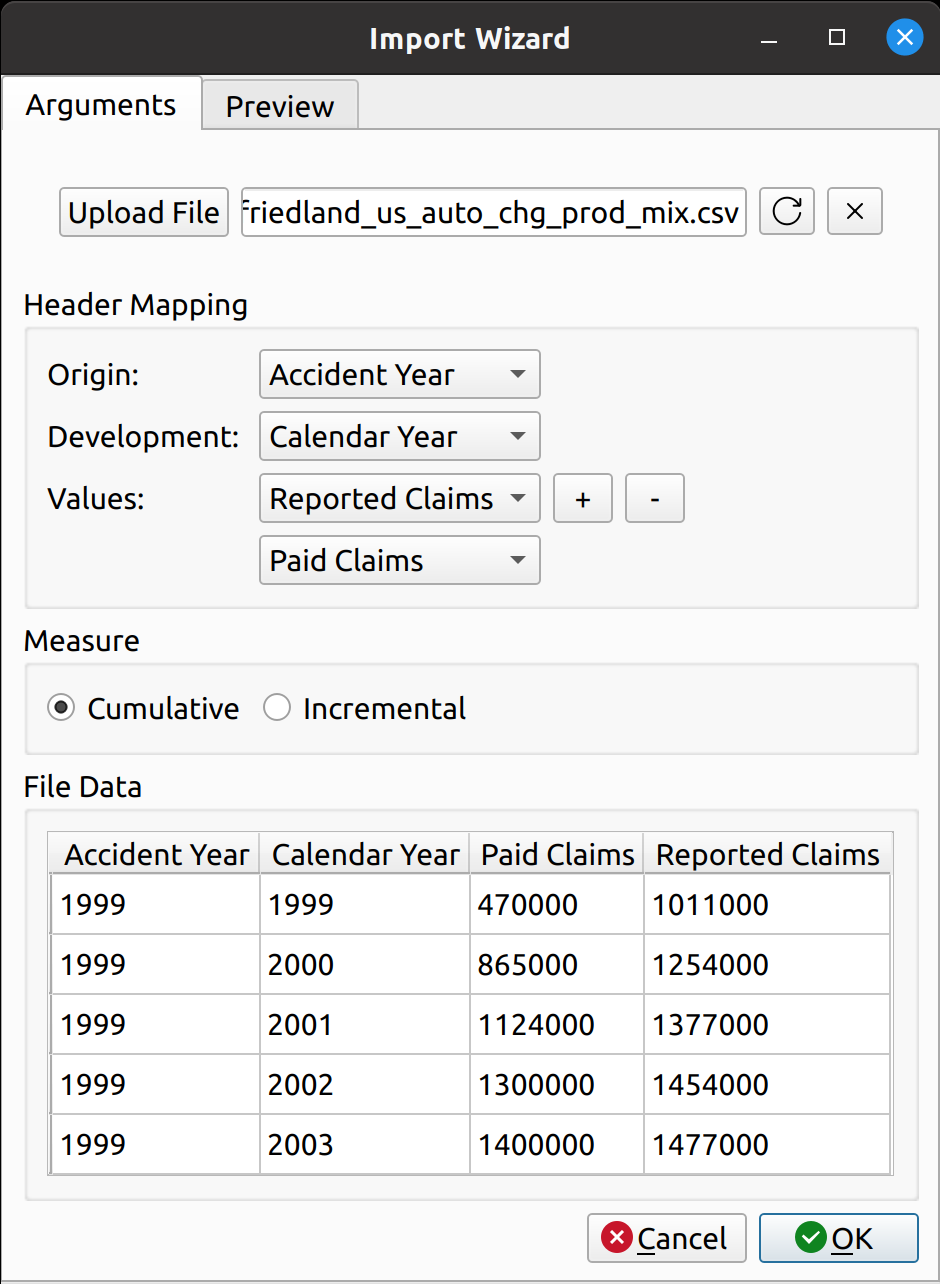
Uploading files is as simple as it gets. You click the upload button, and then the wizard reads in the data and displays it in the File Data section on the bottom. The file headers are read and are then provided as options to map to the triangle fields.
Smart Mapping
The next step is to map the CSV headers to the triangle fields. In chainladder, this is done by providing arguments to the data, origin, development, columns, and cumulative parameters to the Triangle class:
|
1 2 3 4 5 6 7 8 |
raa = cl.Triangle( raa_df, origin="origin", development="development", columns="values", cumulative=True, ) raa |
Notice how the dropdown fields correspond to these arguments. This is how FASLR generates the triangles behind the scenes. It would be tedious, however, to map the CSV headers to these arguments manually every time, so the import wizard provides a smart mapping to automatically pick certain commonly used columns. For example, accident year often corresponds to “origin” and something like paid losses would often correspond to “values”. There is no special AI here, this is just done via business rules using pre-populated dictionaries that can be configured and customized by the user.
The user can also select the number of value columns to be used for the triangle by clicking the “+” and “-” buttons – for example, if the data file has both paid and reported losses, you can increase the number of columns to account for this.
Triangle Preview
Once the mapping is done, the user can preview the generated triangle by clicking on the “Preview” tab. This tab is populated by the same analysis widget discussed in my last post.
The following video illustrates the entire process in action:
PyQt6 Transition
Another thing that happened since the last release is that FASLR has now been upgraded from PyQt5 to PyQt6. Qt6 has been around for some time, so the transition was planned last year to happen in October of this year once all the features from Qt5 became available. There were some hiccups, but overall the process went smoothly. I have another post planned to discuss it.
