\[\int^a_b \mathrm{d}Z(t) = \lim_{n \to \infty} \sum^n_{i=1}\left(Z\left(\frac{ia}{n}\right)-Z\left(\frac{(i-1)a}{n}\right)\right) \]
Hey everyone,
I’m struggling to absorb all the material necessary to pass MFE, but if I can just plow through the 3 remaining chapters I think I’ll be OK. I keep telling myself not to freak out because everyone else says that the last quarter of MFE is notoriously difficult. You’re not expected to master the theoretical details of Brownian motion or Itô processes but you are expected to be able to understand the basics and be able to manipulate mathematical expressions to make meaningful calculations – such as pricing bonds and options – but even that can be intimidating, especially to those (like me) who haven’t taken a course on differential equations.
The figure above represents a stochastic integral – this is kind of like the type of integral you learned in elementary calculus except in this case the function Z(t) is not a fixed function – it is a function that returns a random value from a normal distribution whose parameters vary with respect to time. This particular integral calculates the movement of a stock price from time b to time a. Another thing we might want to model is the total variation of the process – which is the arc length of the stock price trajectory (we use the absolute value because we want down-moves, which are negative, to add to the arc length) :
\[ \lim_{n to \infty}\sum^n_{i=1}\left|X\left(\frac{iT}{n}\right)-X\left(\frac{(i-1)T}{n}\right)\right| \]
An interesting note is that as n approaches infinity, the probability the trajectory crosses its starting point an infinite number of times equals 1 (I have a hard time imagining this).
The image below is a visual representation of Brownian motion with different shades of blue representing a different number of steps. Note that this wouldn’t be appropriate for stock prices because ideally, we would want the trajectory to only traverse positive time and value:

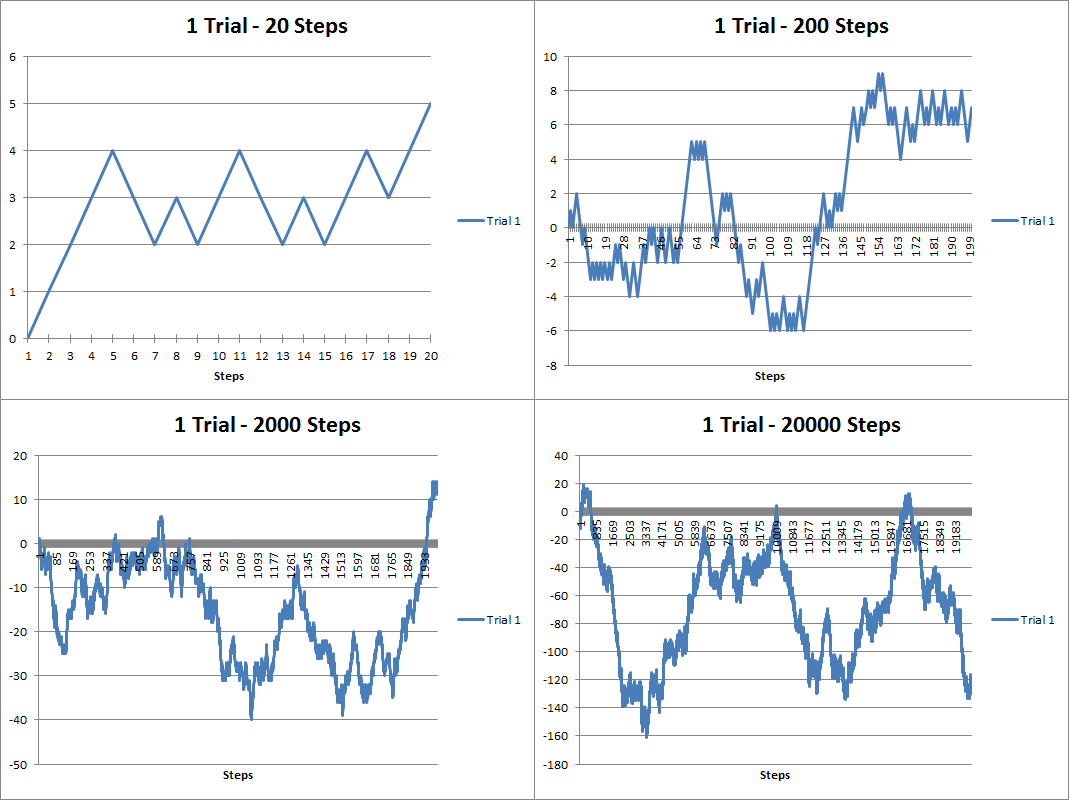
Anyway, over a year ago I dabbled with some discrete stochastic processes using VBA. Here are some random walks I generated:
The above figure are random walks generated using 20, 200, 2000 and 20000 steps. You can see that it looks kind of like a stock chart except the values can be negative. As the number of steps increases, the trajectory looks more like a curve. Brownian motion is when the number of steps becomes infinitely large and the time between steps infinitely small. Below you’ll see that I’ve overlapped several trials below. As the number of trials increases, you can see that the results take up more and more of the possible trajectory space:
About a year and a half ago I had created a youtube video showing how you can animate the random walks in VBA:
Here’s part of the source code I used to generate the walks:
[code language=”vb” wraplines=”TRUE” collapse=”TRUE”]
Sub randwalk()
Dim x As Double
Dim y As Long, z As Double, m As Integer, n As Integer, s As Integer
Dim randarray() As Double
Dim ymax As Integer
Dim ChtObj As ChartObject
Dim Steps As Double, Trials As Double
Dim stup As Double, stdown As Double
Dim pstup As Double, pstown As Double
Dim frate As Double
starttime = Timer
Application.ScreenUpdating = False
For Each ChtObj In Worksheets(“Graph”).ChartObjects
ChtObj.Delete
Next ChtObj
Worksheets(“Data”).UsedRange.Clear
Steps = Range(“STEPS”).Value
Trials = Range(“TRIALS”).Value
stup = Range(“STUP”).Value
stdown = Range(“STDOWN”).Value
pstup = Range(“PSTUP”).Value
frate = Range(“FRATE”).Value
ReDim randarray(0 To Steps) As Double
For m = 0 To Trials – 1
z = Range(“STARTVAL”).Value
randarray(0) = Range(“STARTVAL”).Value
For y = 1 To Steps
x = Rnd()
If x >= (1 – pstup) Then x = stup Else x = -1 * stdown
If Range(“FTYPE”).Value = “Arithmetic” Then
z = z + x
Else
z = z * (1 + x)
End If
randarray(y) = z
Next y
Worksheets(“Data”).Range(“A1”).Offset(0, m).Value = “Trial ” & m + 1
Worksheets(“Data”).Range(“A2:A” & Steps + 1).Offset(0, m) = WorksheetFunction.Transpose(randarray)
Next m
If Range(“COMP”).Value = “Yes” Then
For n = 1 To Steps
randarray(n) = randarray(n – 1) * (1 + frate)
Next n
Worksheets(“Data”).Range(“A1:A” & Steps + 1).Offset(0, Trials) = WorksheetFunction.Transpose(randarray)
End If
Dim MyChart As Chart
Dim DataRange As Range
Set DataRange = Worksheets(“Data”).UsedRange
Set MyChart = Worksheets(“Graph”).Shapes.AddChart.Chart
MyChart.SetSourceData Source:=DataRange
MyChart.ChartType = xlLine
With Worksheets(“Graph”).ChartObjects(1)
.Left = 1
.Top = 1
.Width = 400
.Height = 300
.Chart.HasTitle = True
If Trials = 1 Then
.Chart.ChartTitle.Text = Trials & ” Trial – ” & Range(“FTYPE”).Value & ” Progression”
Else
.Chart.ChartTitle.Text = Trials & ” Trials – ” & Range(“FTYPE”).Value & ” Progression”
End If
.Chart.PlotBy = xlColumns
End With
With MyChart.Axes(xlCategory)
.MajorTickMark = xlTickMarkCross
.AxisBetweenCategories = False
.HasTitle = True
.AxisTitle.Text = “Steps”
End With
For s = 1 To Trials
MyChart.SeriesCollection(s).Name = “Trial ” & s
Next s
If Range(“COMP”).Value = “Yes” Then
MyChart.SeriesCollection(Trials + 1).Name = “Fixed Growth”
MyChart.SeriesCollection(Trials + 1).Interior.Color = “black”
End If
Range(“MAXVAL”).Value = WorksheetFunction.Max(Worksheets(“Data”).UsedRange)
Range(“MINVAL”).Value = WorksheetFunction.Min(Worksheets(“Data”).UsedRange)
Range(“EXECTIME”).Value = Format(Timer – starttime, “00.000”)
Application.ScreenUpdating = True
End Sub
[/code]

