Hey everyone,
I’ve got some good news – I passed CA2 a few weeks ago and I’m glad I was able to knock out that requirement shortly after I passed CA1. The bad news is that I’ve only written three posts this year when I should have had ten, so I’ve got some catching up to do. Over the past couple of months, I’ve mostly been studying material related to the insurance industry, but I try to squeeze in some math or programming whenever I have time. Lately, I’ve been learning how to work with the SQL Server Management Studio interface to aggregate large datasets at work. For statistics, I’ve continued my studies with Verzani’s Using R for Introductory Statistics, which I started reading last year, but put off until this year due to exams. Today, I’d like to show you some of R’s plotting capabilities – we’ll start off with a plot of the standard normal distribution, and I’ll demonstrate how you can change the shape of the plotted distribution by adjusting its parameters.
If you’ve taken statistics, you’re most likely familiar with the normal distribution:
\[ f(x) = \frac{1}{\sigma\sqrt{2\pi}}\mathrm{e}^{-\frac{(x-\mu)^2}{2\sigma^2}} \]
One of the nice things about this distribution is that its two parameters are the mean and variance, which are common statistics used in everyday language. The mean is the average, a measure of central tendency that describes the center of the distribution, and the variance is a statistic that describes the spread of the distribution – how widely the data points deviate from the mean. The following code generates a plot of the density function of a standard normal random variable, and then adds two curves that depict the same distribution shifted to the left:
[code language=”r”]
#Standard normal, then shifted to the left
x <- seq(-6,6,length=500)
plot(x,dnorm(x,mean=0,sd=1),type = “l”,lty=1,lwd=3,col=”blue”,main=”Normal Distribution”,ylim=c(0,0.5),xlim=c(-6,6),ylab=”Density”)
curve(dnorm(x,-1,1),add=TRUE,lty=2,col=”blue”)
curve(dnorm(x,-2,1),add=TRUE,lty=3,col=”blue”)
legend(2,.5,legend=c(“N ~ (0, 1)”,”N ~ (-1, 1)”,”N ~ (-2, 1)”),lty=1:3,col=”blue”)
[/code]
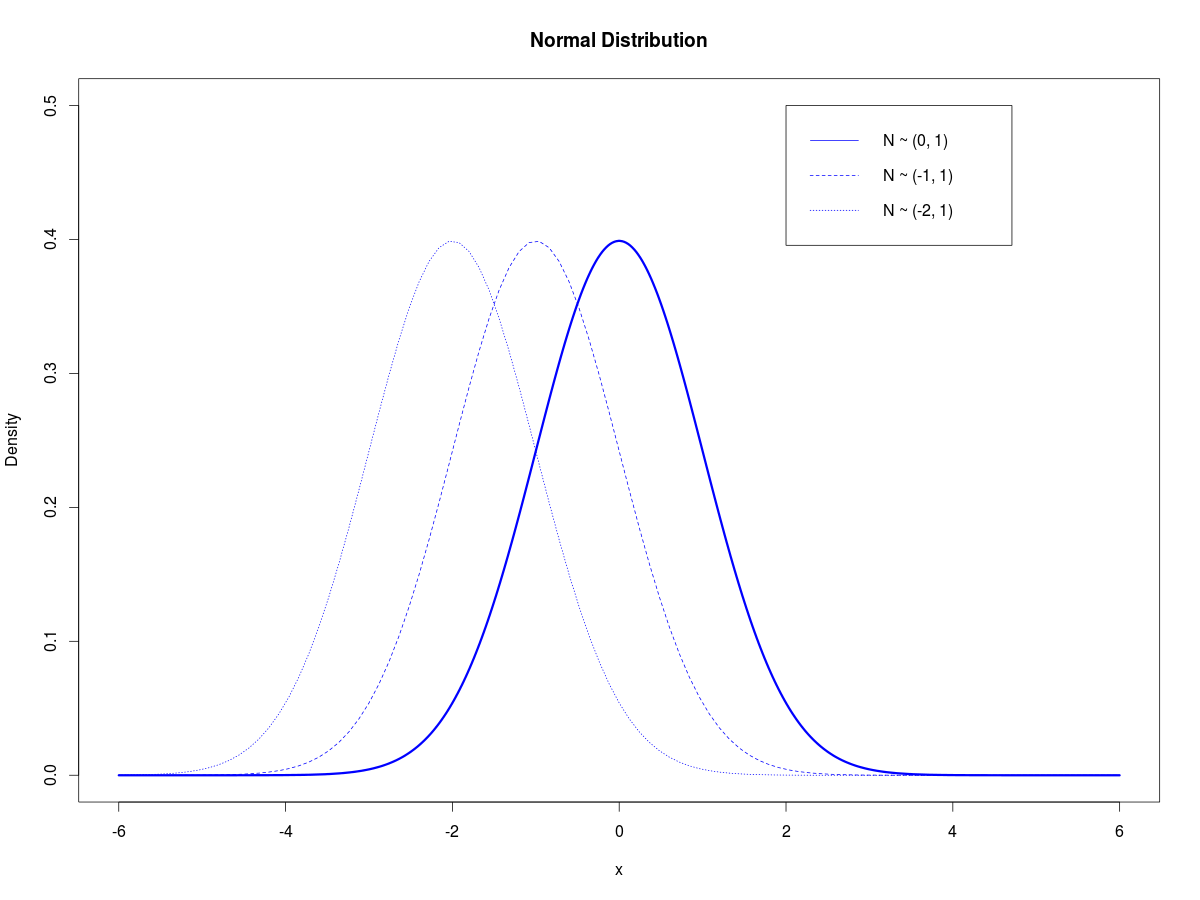 The code first generates a vector of length 500. This vector is then used as an argument to the dnorm() function, which returns the normal density of each element of the input vector. Notice that in line 2, dnorm(x,mean=0,sd=1) is a function with 3 arguments – the first specifies the input vector, the second specifies that the mean of the distribution equals 0, and the third argument specifies that the standard deviation of the distribution equals 1. The function returns a vector of densities which are in turn used as an input to the plot() function, which generates the solid blue line in the above figure. The next two lines of the script add the same distribution shifted 1 and 2 units to the left. You can see that in these two lines, the 2nd argument of the dnorm() function is -1 and -2, respectively – this means that I changed the mean of the distribution to -1 and -2, from 0, causing the leftward shift that you see above.
Similarly, I can shift the distribution to the right by increasing the mean:
[code language=”r”]
#Standard normal, then shifted to the right
x <- seq(-6,6,length=500)
plot(x,dnorm(x,mean=0,sd=1),type = “l”,lty=1,lwd=3,col=”purple”,main=”Normal Distribution”,ylim=c(0,0.5),xlim=c(-6,6),ylab=”Density”)
curve(dnorm(x,1,1),add=TRUE,lty=2,col=”purple”)
curve(dnorm(x,2,1),add=TRUE,lty=3,col=”purple”)
legend(-5.5,.5,legend=c(“N ~ (0, 1)”,”N ~ (1, 1)”,”N ~ (2, 1)”),lty=1:3,col=”purple”)
[/code]
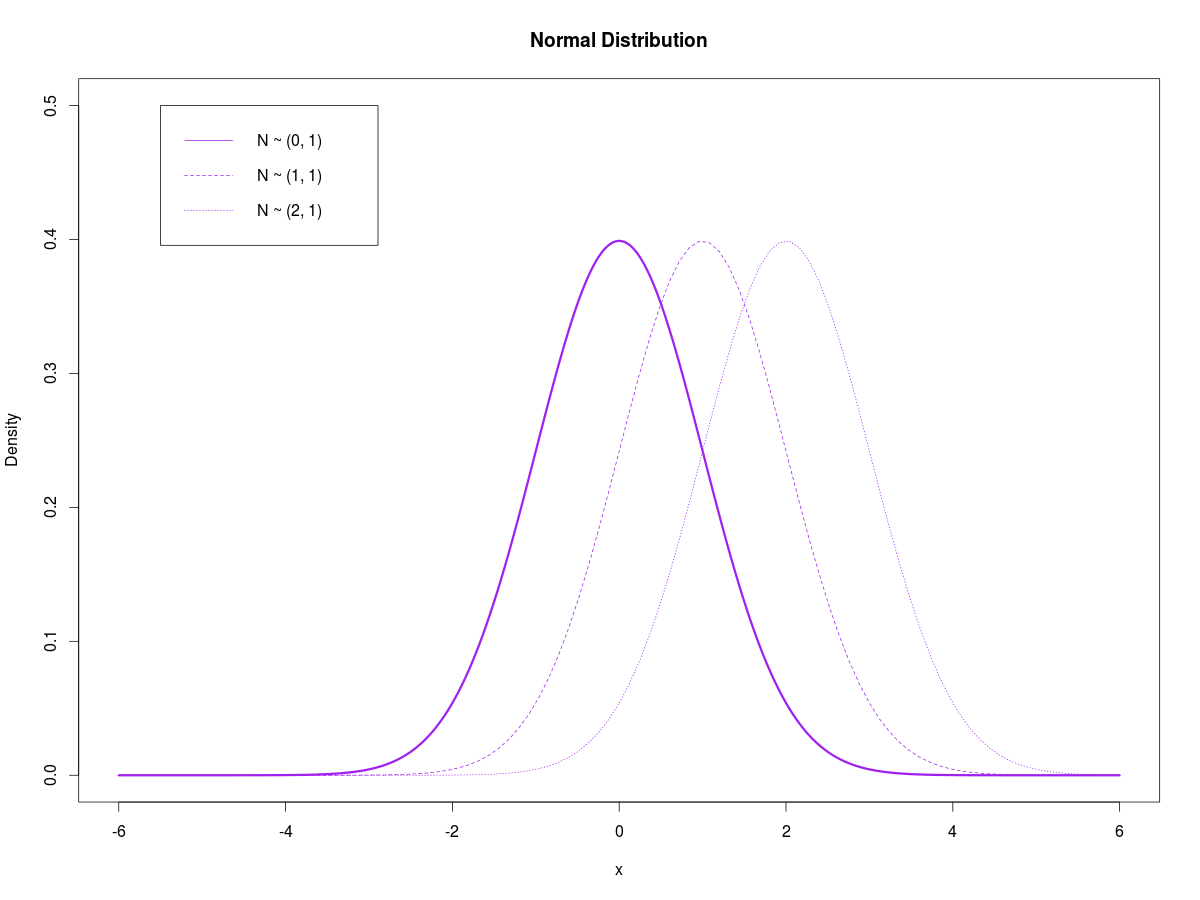
Notice that I can change the position of the legend by specifying the x and y coordinates in the first two arguments of the legend() function.
The next script keeps the mean at 0, but adds two curves with the standard deviation increased to 1 and 2:
[code language=”r”]
#Standard normal, then increased variance
x <- seq(-6,6,length=500)
plot(x,dnorm(x,mean=0,sd=1),type = “l”,lty=1,lwd=3,col=”black”,main=”Normal Distribution”,ylim=c(0,0.5),xlim=c(-6,6),ylab=”Density”)
curve(dnorm(x,0,1.5),add=TRUE,lty=2,col=”red”)
curve(dnorm(x,0,2),add=TRUE,lty=3,col=”black”)
legend(-5.5,.5,legend=c(“N ~ (0, 1)”,”N ~ (0, 2.25)”,”N ~ (0, 4)”),lty=1:3,col=c(“black”,”red”,”black”))
[/code]

Here, I made the middle curve red by using the “col” argument in the plot() function. Personally, plotting is one of my favorite things to do with R. I feel that visualizing data helps you gain an intuitive grasp on the subject, and reveals patterns that you might not otherwise see with aggregated tables or simple summary statistics. Later on this week (hopefully tomorrow), I’ll demonstrate some simple simulations with the normal distribution.
Just what I needed… Thanks!