Today I’d like to demonstrate a few examples of simulation by using R’s built-in pseudorandom number generator. We’ll start by calling the function runif(n), which returns a vector of n draws from the uniform distribution on the interval [0,1]. To see what I mean, runif(50) will return 50 random numbers between 0 and 1 (inclusive):
[code language=”r” wraplines=”FALSE”]> runif(50)
[1] 0.79380213 0.02640186 0.48848994 0.50689348 0.27242565 0.37866590 0.50134423 0.04855088 0.35709235 0.06587394 0.04107046 0.52542577 0.31302174
[14] 0.65262709 0.60967237 0.45131387 0.55305078 0.83903314 0.72698109 0.06292518 0.47579002 0.15186000 0.71345801 0.71252703 0.22304757 0.20179550
[27] 0.57375115 0.06144426 0.87460214 0.87085905 0.52197596 0.79827053 0.35533929 0.23212775 0.30441290 0.29824819 0.59430450 0.92366848 0.63523013
[40] 0.59757710 0.67266388 0.06165364 0.12924342 0.10372910 0.49521401 0.31687057 0.08331765 0.51155404 0.35502189 0.65212223
[/code]
Interestingly, the numbers generated above aren’t actually random. R uses a process called pseudorandom number generation, which uses an algorithm to generate a long string of deterministic digits that appear to be random to most people, unless they have godlike powers of pattern recognition. The algorithm acts upon an initial value, called a seed, and for each seed the algorithm will return the same sequence of numbers. The term period refers to how long the sequence can go before it repeats itself. For example, Microsoft Excel’s PRNG (pseudorandom number generator) has a relatively short period, as (depending on the application) the sequence of numbers will repeat itself unless you frequently re-seed the algorithm. That is, if you generate a sequence 938745…, you’ll see 938745… again without too many draws.
The default PRNG used by R is called the Mersenne Twister, an algorithm developed in 1998 by Matsumoto and Nishimura. Other choices are available, such as Wichman-Hill, Marsaglia-Multicarry, Super-Duper, Knuth-TAOCP, and L’Ecuyer-CMRG. You can even supply your own PRNG, if you wish.
We can plot a histogram of a vector of generated numbers in order to observe the distribution of our sample. Below, you’ll see a 4-plot panel depicting samples from a uniform distribution on [0,1], with different draws per sample:
[code language=”r”]
#Uniform Sampling
par(mfrow=c(2,2))
for(i in 1:4){
x <- runif(10**i)
hist(x,prob=TRUE, col=”grey”,ylim=c(0,2),main = paste(10**i,” Draws”))
curve(dunif(x),add=TRUE,col=”red”,lwd=2)}
[/code]
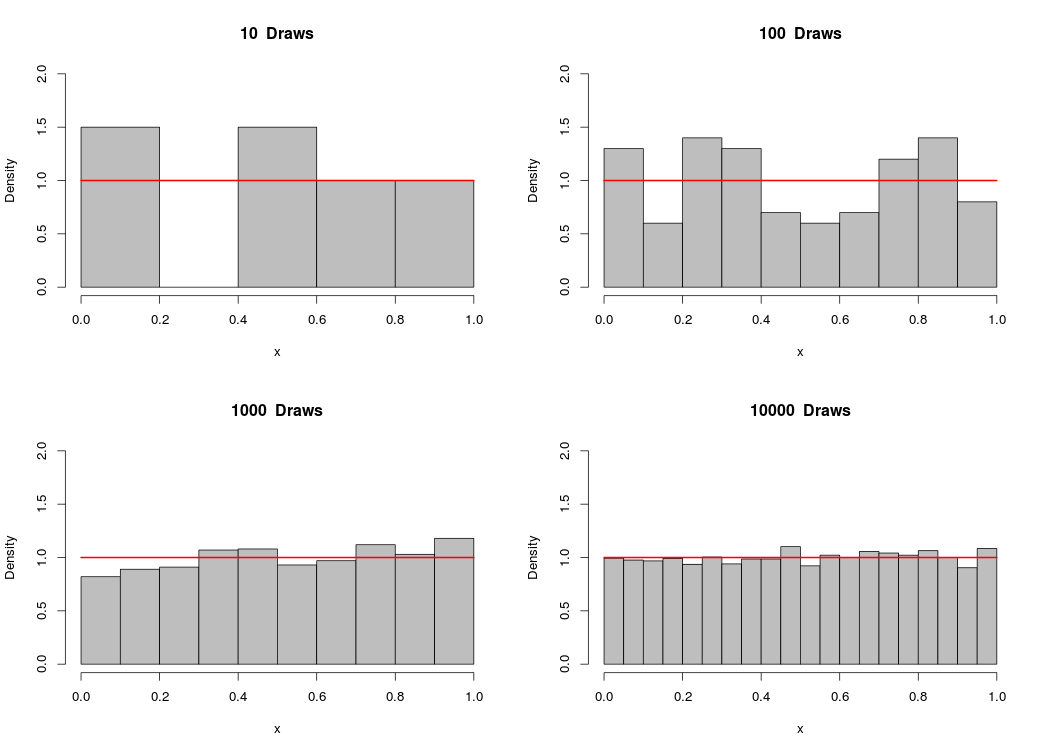
As you can see, the sample approaches the uniform distribution as the number of draws becomes larger.
Similarly, we can simulate observations from the normal distribution by calling the function rnorm(n,mean,sd), which returns a vector of n draws from the normal distribution with mean=mean and standard deviation = sd:
[code language=”r”]
#Normal Sampling
par(mfrow=c(2,2))
for(i in 1:4){
x <- rnorm(10**i)
hist(x,prob=TRUE,col=”grey”,ylim=c(0,.6),xlim=c(-4,4),main=paste(10**i,” Draws”))
curve(dnorm(x),add=TRUE,col=”red”,lwd=2)}
[/code]
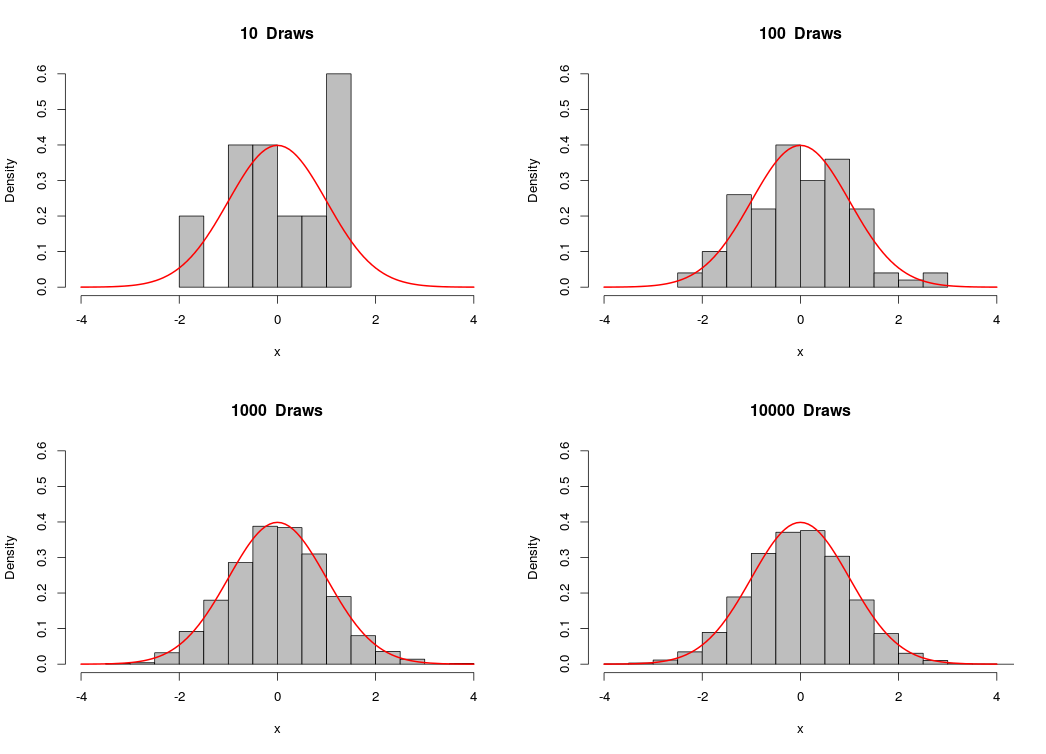 Likewise, as the number of draws gets bigger, the sample approaches the normal distribution.
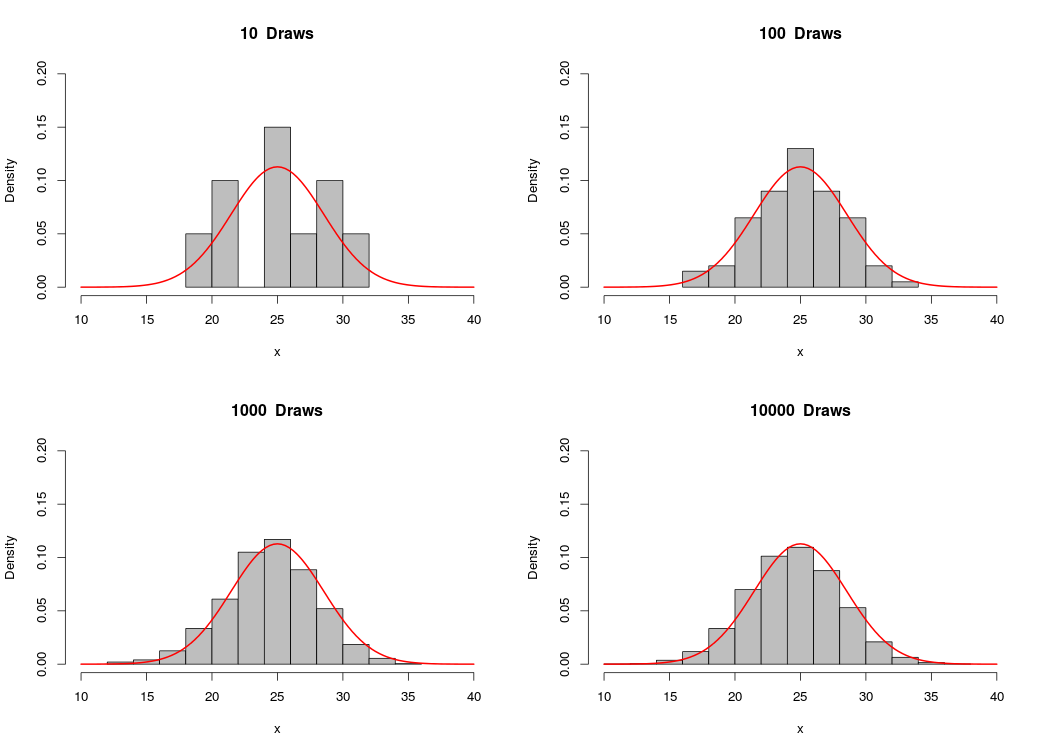
We can use R to demonstrate the binomial approximation to the normal distribution. The binomial distribution with parameters n and p is approximately normal with mean np and variance np(1-p), with n large and p not too small. We’ll draw from the binomial distribution with n = 50 and p = .5, and then plot a normal curve with mean = 25 and variance = 12.5. Notice that as we increase the number of draws, the histrogram looks more and more like the normal distribution:
[code language=”r”]
#Binomial approximation to Normal
par(mfrow=c(2,2))
n <- 50
p <- .5
for(i in 1:4){
x <- rbinom(10**i,n,p)
hist(x,prob=TRUE,col=”grey”,ylim=c(0,.2),xlim=c(10,40),main=paste(10**i,” Draws”))
curve(dnorm(x,n*p,sqrt(n*p*(1-p))),add=TRUE,col=”red”,lwd=2)}
[/code]
For fun, I decided to see how many simulated values my computer could handle. I created a vector of 1 billion draws from the standard normal distribution:
[code language=”r”]
x<-rnorm(1000000000)
hist(x,prob=TRUE,col=”grey”,main=”1000000000 Draws”)
curve(dnorm(x),add=TRUE,col=”red”,lwd=2)
[/code]
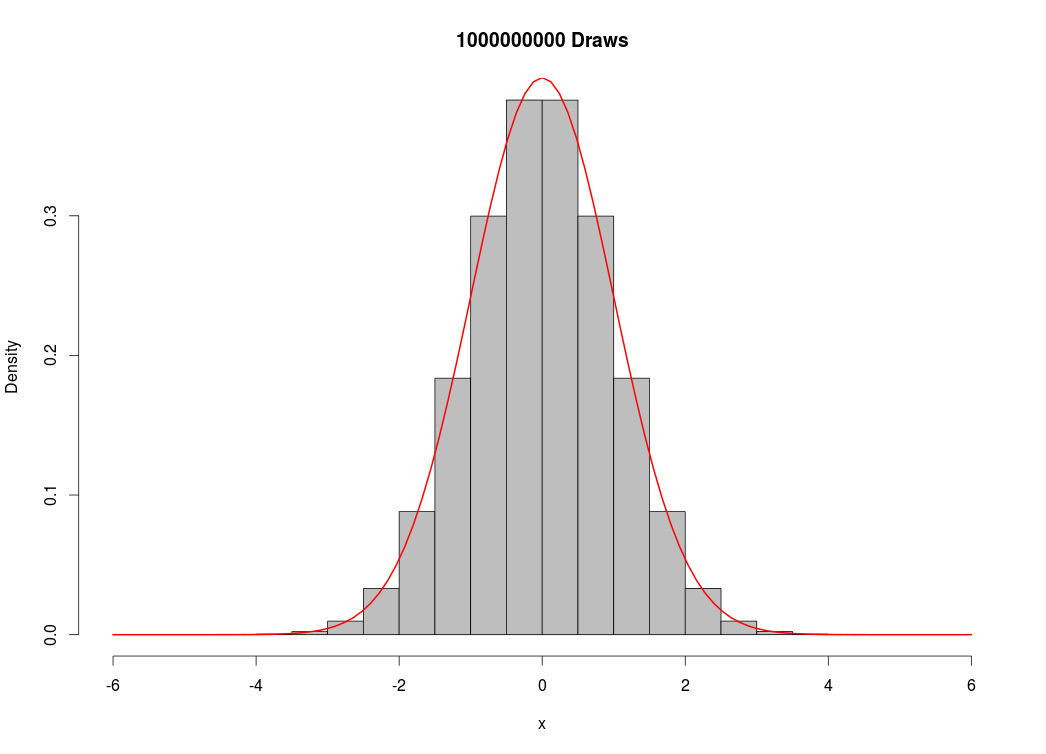
Which took about 20 minutes to execute, using almost all of my computer’s memory (16 GB). This was unnecessary, as I could have reproduced the image above without as many draws. Nevertheless, I’m very impressed with R’s capabilities, as a similar script would have been impossible in Excel if I wanted to store the numbers in memory, or it would have taken much longer if I had even decided to clear the memory throughout the routine.