• Home
  • Readings
  • Github
  • MIES
  • TmVal
  • About
Gene Dan's Blog

Tag Archives: Actuarial Exams

No. 79: First Post of 2013!

8 January, 2013 2:55 AM / Leave a Comment / Gene Dan

I’d like to start the new year with a few short updates:

-I ended up passing MFE back in November. I received a score of 8 (I’m assuming 9 was the highest possible score for my exam), which is one point lower than I would have liked, but nevertheless I’m happy to say that I’m finally done with the preliminary exams and halfway through with the CAS examination process. While I was waiting for my score, I also passed the CA1 module, which isn’t an ‘exam’ (even though it involves one), but one of two, month-long courses I have to take in addition to the exam requirements.

-I recently rotated into a new role at work. Instead of doing traditional reserving, I’ll be doing predictive modeling work full-time under a new supervisor. I had learned about the departmental changes after I took MFE. About a year ago, I began taking on additional responsibilities with modeling, and I’m glad to have been given the opportunity to specialize in this field. There will be a steep learning curve along the way, but I think I’ll gain valuable experience over the next couple of years.

-I didn’t manage to keep my resolution of posting 1 post per week last year. However, I managed to crank out 37 posts, which almost doubled the number of posts I had written from 2008-2011. I had steady updates until the last 3rd of the year when I stopped posting to devote time to courses MFE and CA1, but this year I’ll try my best to maintain the 1 post/week rate. I have some exciting projects that I’m currently working on, so I have a feeling I’ll easily surpass that goal.

-I installed some productivity tools in my browser to monitor the amount of time I spend on the internet. Towards the end of the year, I discovered that I sometimes wasted 6 hours in a single day due to unnecessary internet surfing on sites such as Facebook and Reddit. I also obsessively kept up with the news (ironically, in the past I had trouble keeping up with current events due to schoolwork), which oftentimes left me reading multiple articles over the same subject. I had dabbled with such browser plugins over the past couple of years, but removed them several times due to lack of discipline. This year I resolve to keep the current rules enforced for good. This year I’ve set a window from 9:00 PM to 10:00 PM devoted to social media, sports, news, and related websites (which also means I’ll have to plan my blog posts ahead of time so I can publish them within that window). At all other times during the day access will be blocked so that I can focus on doing my work, and learning the things I want to learn. I believe that strict observation of this rule will allow me to complete a lot more of my projects.

-I started studying for CAS Exam 5 this month. This gives me 4 months of solid study time for my first upper-level examination. At this point, the exams stop being math-intensive, and focus more on insurance industry practices, regulation, and law. While studying for the preliminary exams, I was so overwhelmed with math that I couldn’t focus on learning maths more relevant to my specific job (the math in the exams is related in a background sense, but as far as work goes the actual math I use is much different), along with pure math that I’ve always been wanting to learn. Although the upper examinations require more study time, I think the reduction in math required will let me spend my ‘math energy’ elsewhere.

-I’ve finished up learning the basics of SQL (as in, I’ve finished reading Learning SQL). I’m currently reading Excel & Access Integration, which I believe will give me some very useful skills with respect to data manipulation. Many actuaries know VBA, many actuaries know SQL, but there aren’t a lot of actuaries who can integrate them together effectively, so if I can acquire this ability I’ll be able to fulfill a niche role that’s lacking at many companies. I didn’t find MySQL difficult, and query writing came naturally since I had already been using MSAccess intensively 6 months before picking up the book. The only things I found difficult were correlated subqueries and the chapters on low-level database design and administration. The next thing I have on my reading list is Using R for Introductory Statistics. I actually read through the first 60 pages or so in 2011 before I stopped to study for C/4. I hope to get that finished up before March when things get really busy.

Posted in: Logs / Tagged: Actuarial Exams, exam MFE, exam mfe pass mark, exam MFE score, Learning SQL, predictive modeling, R

No. 77: Stochastic Calculus on a Friday Night

13 October, 2012 2:21 AM / Leave a Comment / Gene Dan

\[\int^a_b \mathrm{d}Z(t) = \lim_{n \to \infty} \sum^n_{i=1}\left(Z\left(\frac{ia}{n}\right)-Z\left(\frac{(i-1)a}{n}\right)\right) \]
Hey everyone,

I’m struggling to absorb all the material necessary to pass MFE, but if I can just plow through the 3 remaining chapters I think I’ll be OK. I keep telling myself not to freak out because everyone else says that the last quarter of MFE is notoriously difficult. You’re not expected to master the theoretical details of Brownian motion or Itô processes but you are expected to be able to understand the basics and be able to manipulate mathematical expressions to make meaningful calculations – such as pricing bonds and options – but even that can be intimidating, especially to those (like me) who haven’t taken a course on differential equations.

The figure above represents a stochastic integral – this is kind of like the type of integral you learned in elementary calculus except in this case the function Z(t) is not a fixed function – it is a function that returns a random value from a normal distribution whose parameters vary with respect to time. This particular integral calculates the movement of a stock price from time b to time a. Another thing we might want to model is the total variation of the process – which is the arc length of the stock price trajectory (we use the absolute value because we want down-moves, which are negative, to add to the arc length) :
\[ \lim_{n to \infty}\sum^n_{i=1}\left|X\left(\frac{iT}{n}\right)-X\left(\frac{(i-1)T}{n}\right)\right| \]
An interesting note is that as n approaches infinity, the probability the trajectory crosses its starting point an infinite number of times equals 1 (I have a hard time imagining this).

The image below is a visual representation of Brownian motion with different shades of blue representing a different number of steps. Note that this wouldn’t be appropriate for stock prices because ideally, we would want the trajectory to only traverse positive time and value:

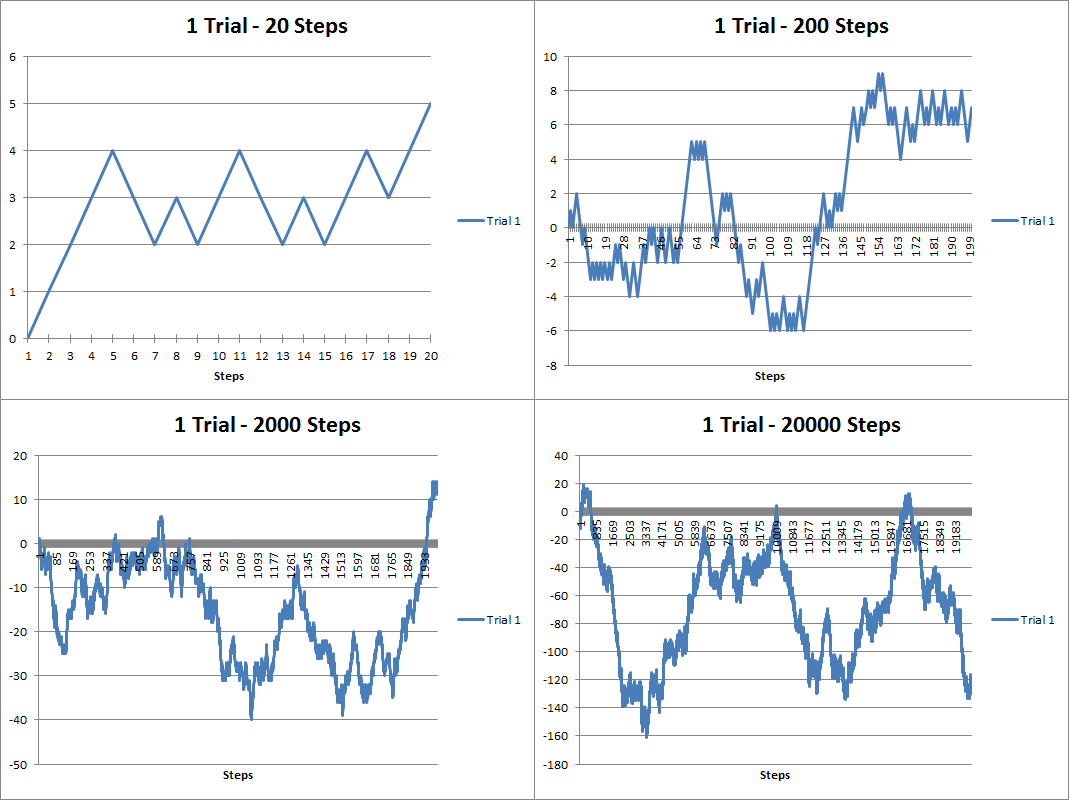
Anyway, over a year ago I dabbled with some discrete stochastic processes using VBA. Here are some random walks I generated:

The above figure are random walks generated using 20, 200, 2000 and 20000 steps. You can see that it looks kind of like a stock chart except the values can be negative. As the number of steps increases, the trajectory looks more like a curve. Brownian motion is when the number of steps becomes infinitely large and the time between steps infinitely small. Below you’ll see that I’ve overlapped several trials below. As the number of trials increases, you can see that the results take up more and more of the possible trajectory space:

About a year and a half ago I had created a youtube video showing how you can animate the random walks in VBA:

Here’s part of the source code I used to generate the walks:

[code language=”vb” wraplines=”TRUE” collapse=”TRUE”]

Sub randwalk()

Dim x As Double
Dim y As Long, z As Double, m As Integer, n As Integer, s As Integer
Dim randarray() As Double
Dim ymax As Integer
Dim ChtObj As ChartObject
Dim Steps As Double, Trials As Double
Dim stup As Double, stdown As Double
Dim pstup As Double, pstown As Double
Dim frate As Double

starttime = Timer

Application.ScreenUpdating = False

For Each ChtObj In Worksheets(“Graph”).ChartObjects
ChtObj.Delete
Next ChtObj

Worksheets(“Data”).UsedRange.Clear

Steps = Range(“STEPS”).Value
Trials = Range(“TRIALS”).Value
stup = Range(“STUP”).Value
stdown = Range(“STDOWN”).Value
pstup = Range(“PSTUP”).Value
frate = Range(“FRATE”).Value

ReDim randarray(0 To Steps) As Double

For m = 0 To Trials – 1
z = Range(“STARTVAL”).Value
randarray(0) = Range(“STARTVAL”).Value
For y = 1 To Steps
x = Rnd()
If x >= (1 – pstup) Then x = stup Else x = -1 * stdown
If Range(“FTYPE”).Value = “Arithmetic” Then
z = z + x
Else
z = z * (1 + x)
End If
randarray(y) = z
Next y
Worksheets(“Data”).Range(“A1”).Offset(0, m).Value = “Trial ” & m + 1
Worksheets(“Data”).Range(“A2:A” & Steps + 1).Offset(0, m) = WorksheetFunction.Transpose(randarray)
Next m

If Range(“COMP”).Value = “Yes” Then
For n = 1 To Steps
randarray(n) = randarray(n – 1) * (1 + frate)
Next n

Worksheets(“Data”).Range(“A1:A” & Steps + 1).Offset(0, Trials) = WorksheetFunction.Transpose(randarray)
End If

Dim MyChart As Chart
Dim DataRange As Range
Set DataRange = Worksheets(“Data”).UsedRange
Set MyChart = Worksheets(“Graph”).Shapes.AddChart.Chart
MyChart.SetSourceData Source:=DataRange
MyChart.ChartType = xlLine

With Worksheets(“Graph”).ChartObjects(1)
.Left = 1
.Top = 1
.Width = 400
.Height = 300
.Chart.HasTitle = True
If Trials = 1 Then
.Chart.ChartTitle.Text = Trials & ” Trial – ” & Range(“FTYPE”).Value & ” Progression”
Else
.Chart.ChartTitle.Text = Trials & ” Trials – ” & Range(“FTYPE”).Value & ” Progression”
End If
.Chart.PlotBy = xlColumns

End With

With MyChart.Axes(xlCategory)
.MajorTickMark = xlTickMarkCross
.AxisBetweenCategories = False
.HasTitle = True
.AxisTitle.Text = “Steps”
End With

For s = 1 To Trials
MyChart.SeriesCollection(s).Name = “Trial ” & s
Next s

If Range(“COMP”).Value = “Yes” Then
MyChart.SeriesCollection(Trials + 1).Name = “Fixed Growth”
MyChart.SeriesCollection(Trials + 1).Interior.Color = “black”
End If

Range(“MAXVAL”).Value = WorksheetFunction.Max(Worksheets(“Data”).UsedRange)
Range(“MINVAL”).Value = WorksheetFunction.Min(Worksheets(“Data”).UsedRange)
Range(“EXECTIME”).Value = Format(Timer – starttime, “00.000”)

Application.ScreenUpdating = True

End Sub
[/code]

Posted in: Logs / Tagged: Actuarial Exams, brownian motion, exam MFE, random walks, stochastic calculus, stochastic processes, VBA

No. 43: A Perfect Score, Imperfect Preparation

10 January, 2012 2:19 AM / 1 Comment / Gene Dan

Hey everyone,

I just wanted to make this quick because I need to wake up early tomorrow. I just wanted to let you know that I received a perfect score of 10 on Exam MLC/3L, which I received today to my relief. This is my second perfect score – I got also got a 10 on FM/2 last year. I felt confident that I would pass but today confirmed how well I thought I did after I took the test. A score of 10 doesn’t mean that I answered every single question correctly, which I probably didn’t since I had to guess on a handful of them when I ran out of time towards the end of the test. Rather, the SOA determines an initial pass mark (usually around 18 or 19 of the 30 questions), equates that to a 6, and increments the score equating each previous or subsequent point to 10% of the pass mark. For instance, if they set the pass mark at 19, a score of 6 means you got 19 right on the exam. A score of 7 means you got 21 or 22 right (since 19 + 1.9 = 20.9), a score of 8 means you got 23 or 24 right, and so on.

A score of 10 means I finished somewhere on the right side of the distribution – but since the SOA doesn’t release the distribution of scores I can’t determine my percentile or performance relative to my peers, though they do release the pass rate which usually ends up somewhere between 40%-55% of the candidates. Although I do feel satisfied with the result, I don’t feel happy with the way I studied or prepared for the exam. I skipped the May sitting because I moved to Memorial for my new job, and I had to take care of a lot of “firsts” in life such as apartment rent, savings and retirement accounts, bills, and so on and so forth, which may or may not belong to the set of acceptable excuses for skipping an important professional exam. Furthermore, the SOA introduced significant changes to the MLC syllabus effective in 2012, so skipping the first sitting in 2011 meant that I only had one shot to pass before the exam change. Also, I only started studying in mid-August which gave me about 2.75 months to study (which may seem ideal for others, but short for me). I studied frantically, and I don’t think I paced myself well at all.

Anyway, I can at least put away the anxiety of the hardest preliminary exam, but I’ve made it my goal to not make the same mistakes as I have in the past. The next exam, C/4, from what I hear has easier problems than those in MLC, but the calculations require more steps, which leaves more space for human error so I have to tread carefully. The exam feels more like an older sibling to the first exam, P/1 since you work with probability distributions, but work with more sophisticated modeling techniques and more complicated distributions. I decided to change my method of study to include a lot more rote memory since the exam focuses more on knowledge of methods, rather than insight and creativity (the C/4 questions are more similar to “do this method on this data set” as opposed to the “what can you conclude from this” style questions found on MLC). I’ve already created a Temporary Memory Bank in written form (you can find the file on my sky drive as “temp_mem_bank”), which includes concepts that I’ve committed to memory for this test, but have not, as of now committed to permanent memory as I have in the Permanent Memory Bank.

I’ve set the word count limit for my posts as 500 for the minimum and 1000 for the maximum. I figured, that updating the blog with extremely short posts would not satisfy the requirements of a New Year’s resolution, so I decided that 500 words seemed appropriate since I had to write brief, 500-word essays every week during my English course of my first semester of college (in addition to 3 longer papers ~5 pages and a term paper ~20 pages). This post, at ~750 words, took me less than an hour. I put a limit of 1000 words since these are blog posts, not dissertations, and I feel no need to bore the time-conscious reader.

As a side note – I ordered some new tubulars for the 2012 race season. One of these is mine:

My new set of wheels is in there, somewhere. Photo by Philip Shama

Posted in: Logs / Tagged: Actuarial Exams, actuarial exams difficulty, Exam C/4, exam MLC passing score, Exam MLC/3L, studying for actuarial exams

Archives

  • September 2023
  • February 2023
  • January 2023
  • October 2022
  • March 2022
  • February 2022
  • December 2021
  • July 2020
  • June 2020
  • May 2020
  • May 2019
  • April 2019
  • November 2018
  • September 2018
  • August 2018
  • December 2017
  • July 2017
  • March 2017
  • November 2016
  • December 2014
  • November 2014
  • October 2014
  • August 2014
  • July 2014
  • June 2014
  • February 2014
  • December 2013
  • October 2013
  • August 2013
  • July 2013
  • June 2013
  • March 2013
  • January 2013
  • November 2012
  • October 2012
  • September 2012
  • August 2012
  • July 2012
  • June 2012
  • May 2012
  • April 2012
  • March 2012
  • February 2012
  • January 2012
  • December 2011
  • September 2011
  • August 2011
  • July 2011
  • June 2011
  • January 2011
  • December 2010
  • October 2010
  • September 2010
  • August 2010
  • June 2010
  • May 2010
  • April 2010
  • March 2010
  • September 2009
  • August 2009
  • May 2009
  • December 2008

Categories

  • Actuarial
  • Cycling
  • Logs
  • Mathematics
  • MIES
  • Music
  • Uncategorized

Links

Cyclingnews
Jason Lee
Knitted Together
Megan Turley
Shama Cycles
Shama Cycles Blog
South Central Collegiate Cycling Conference
Texas Bicycle Racing Association
Texbiker.net
Tiffany Chan
USA Cycling
VeloNews

Texas Cycling

Cameron Lindsay
Jacob Dodson
Ken Day
Texas Cycling
Texas Cycling Blog
Whitney Schultz
© Copyright 2025 - Gene Dan's Blog
Infinity Theme by DesignCoral / WordPress