Hey everyone,
Last week, I attended the CAS Predictive Modeling Seminar hosted by Deloitte and instructed by Jim Guszcza and Jun Yang. Jim taught a Loss Models course as a professor at the University of Wisconsin-Madison (and is now returning to full-time work at Deloitte), and Jun works as a statistician for Deloitte’s Analytics department. The seminar focused mainly on theoretical modeling and its use in actuarial practice, and emphasized the use of CRAN as a tool to visualize and manipulate data. Most of the code and examples are proprietary software so I won’t be posting those here. Instead, I’ll touch up on a few concepts that I thought were interesting and provide my thoughts on what I need to learn in order to improve my modeling skills.
Claim Frequency and Severity Independence
Most (I would hope) actuarial students should be familiar with the concepts of claim frequency (how often claims occur), and claim severity (how severe a particular claim is), and their role in pricing premiums and setting reserves. Young students will almost always work out example problems that assume independence between frequency and severity – that is, that information about one of the variables does not reveal information about the other. This assumption leads to a very famous property in Actuarial Science:
$latex displaystyle mathrm{Var}[S] = mathrm{E}[N]mathrm{Var}[X]+mathrm{E}[{X^2}]mathrm{Var}[N]$
Where X represents severity, N represents frequency, and S represents the aggregate loss. In other words, under these assumptions one can conveniently calculate the variance of aggregate losses using known properties of the frequency and severity distributions. However, it’s rarely the case that frequency and severity are independent! Now that’s a big assumption to make. In student manuals there might be a hundred or so problems involving the above formula, but maybe just one or two sentences cautioning the reader that such a formula is a simplified (and possibly wildly different) representation of reality, and one should use “judgement” during practice.
Now, if you thought I was actually going to tell you what you’d need to do in this case, you’d be disappointed because as of this point (I haven’t gotten any work yet that involved this level of detail), I wouldn’t actually know what to do (or maybe I’m just lacking confidence). But from the above, I would guess that you’d have to carefully look at your assumptions (independence assumptions and the identical distribution of variables), and also if you have the time, there’s another variance formula out there that does not assume independence, so you can use that one instead. You’ll have to keep in mind that many of these convenient shortcuts were created in the days without computers (back in the day, calculators didn’t even have log functions), and were used to streamline calculations at the expense of accuracy.
Spline Regression
Most (I would hope) actuarial students should be familiar with the concept of linear regression, especially ordinary least squares regression in which the curve is fit so as to minimize the sum of the squared residuals. However, it’s often the case that the data don’t exhibit a linear trend and you’d want to use a different type of regression such that the fitted curve more closely matches the data. For example, here’s some data fitted using OLS from SAS:
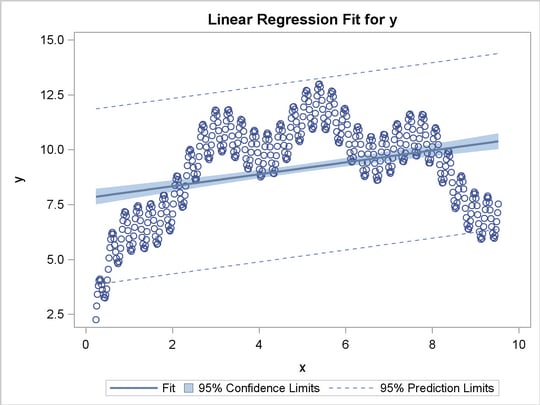
Source: SAS Institute
Visually, you can see that the line fails to capture the undulating shape of the data. On the other hand, here’s the same dataset with spline regression used instead:
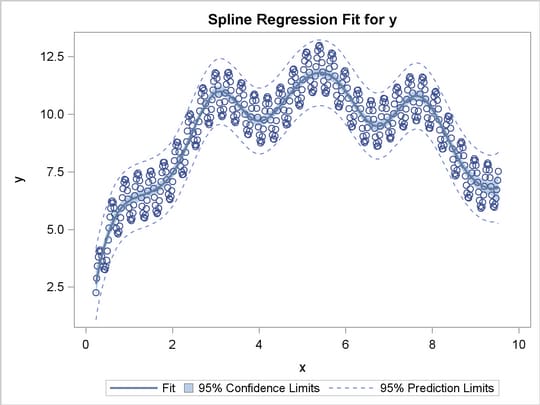
Source: SAS Institute
Here, you can see that spline regression matches the data more closely. One of my coworkers told me that the theory behind splines was difficult to understand. On the other hand, I saw that there were some built-in functions in R that would handle spline regression easily, though I would like to eventually learn the underlying theory myself so as to better understand what I’m doing.
Other Points
So throughout the seminar, Jim stressed the importance of understanding the theory behind your work and not just blindly applying simple formulas for the sake of simplicity. As you can see from above, you can easily produce an inaccurate representation of reality if you use the wrong tools in your models. It was clear to me that Jim spent a lot of his personal time independently studying statistics and a reading a whole lot of textbooks, and I think that gave me a good picture of the hefty time investment required for me to become a good modeler. Oftentimes, other actuaries have told me that theory goes out the window once you’re at work, but I believe that’s a faulty assertion due to a lack of understanding of what mathematics can really accomplish. I suppose that perhaps they used something so simple as linear regression, saw that it didn’t work, and then quickly came to the conclusion that all of statistics was useless.
I asked Jun if most of the people working in his research department had PhDs, and he responded that most of the department didn’t have graduate degrees and that his own PhD provided little value at work. Likewise, Jim didn’t earn his PhD in Math, he earned it in Philosophy – so it seems as if he learned most of his math through many years of independent study. I think the most important thing I gained from the seminar was a framework to guide my studies as I continue to learn on the job, and that learning is a lifelong process and that I should spend a portion of each day trying to learn something new.