• Home
  • Readings
  • Github
  • MIES
  • TmVal
  • About
Gene Dan's Blog

Tag Archives: Latex

No. 117: Amino Acid Structural Formulas with Chemfig (Nonpolar Side Chains)

28 March, 2017 7:46 PM / 1 Comment / Gene Dan

\LaTeX can do some pretty neat things. While it’s mostly known for typesetting mathematical notation, it can also be used to render structural formulas via the chemfig package, which makes it useful in the electronic communication of chemistry concepts – for example, it would allow two chemists located in different countries to chat over a message board, easing collaboration.

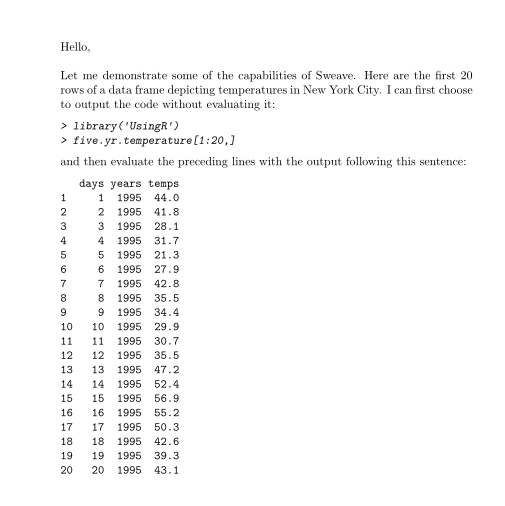
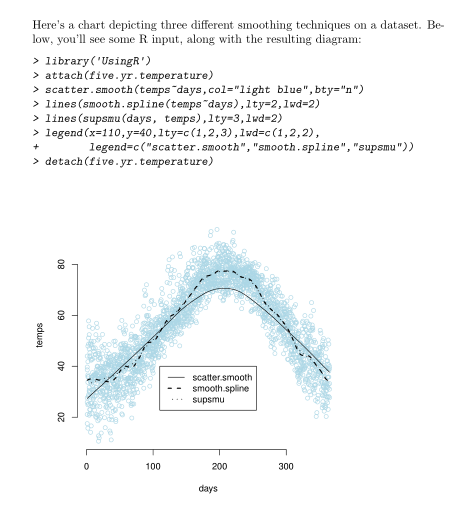
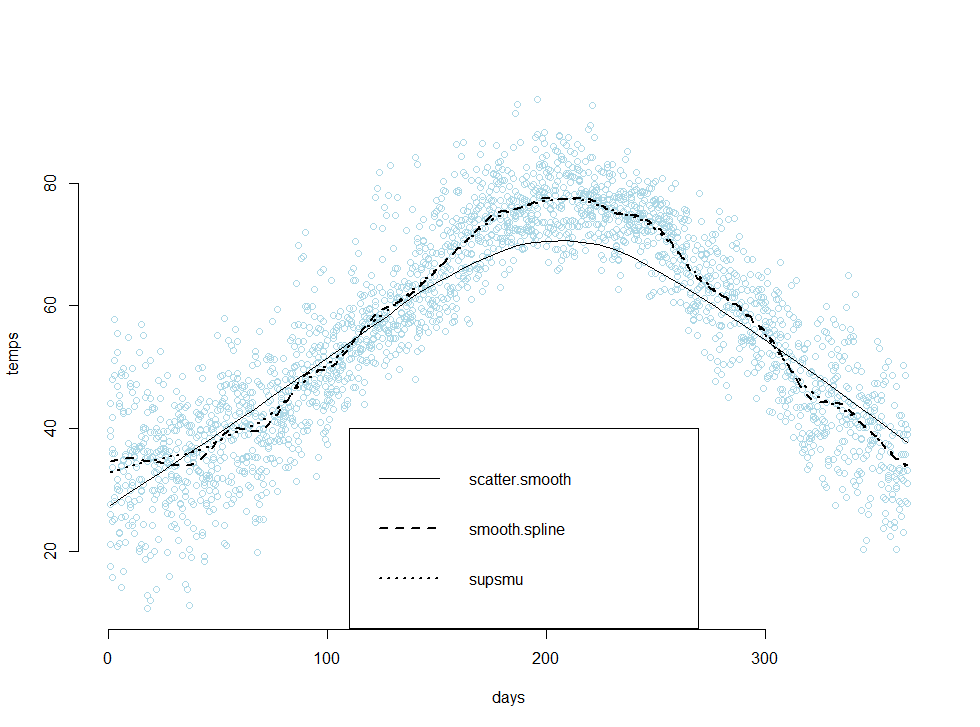
I’ll demonstrate some of the capabilities of chemfig by rendering the structural formulas of amino acids – 20 distinct molecules that serve as the building blocks of proteins – that is, the basis of cellular activity. Below are structural formulas for 9 of these, the ones with nonpolar side chains (this means that the side chains are hydrophobic, and do not have an affinity for water).

Amino Acid Structure
The basic structure of an amino acid consists of an asymmetric carbon bonded to four components – a hydrogen atom, an amino group, a carboxyl group, and an R-group. The amino group can act as a base, accepting a hydrogen ion. The carboxyl group can act as an acid (hence the name, amino acid), donating a hydrogen ion. The R-group is what gives a particular amino acid its identity (that is, whether a particular amino acid is glycine, tryptophan, etc.). It is unique for each type of amino acid and dictates its behavior. The amino group of one amino acid can bond with the carboxyl group of another amino acid, forming a peptide bond. When several amino acids are linked in a chain, they form a polypeptide – and one or more polypeptides together form a protein molecule.

Rendered by QuickLaTeX.com

This basic structure serves as a template for each of the amino acids below. The amino and carboxyl groups, together with the asymetric carbon and lower hydrogen atom, form the amino acid’s contribution to the polypeptide backbone. These are highlighted in blue. The R-group, distinct for each amino acid, is highlighted in red.

Notice that each of the code samples below contains a repeating pattern – \chemfig renders the structural formula of the amino acid. \chemmove draws the boxes that highlight the backbone and R-groups.

1
2
3
4
5
6
7
8
9
10
11
12
13
14
15
16
17
18
19
20
21
22
23
24
25
26
27
28
29
30
31
32
33
34
35
36
37
38
39
40
41
\chemfig{
C(-[:180]@{AR}N(-[:135]H)(-[:225]@{AL}H))(-[:0]@{CL}C(=[:45]@{CR}O)(-[:315]OH))(-[:90]@{R}R)(-[:270]H)
}
 
\chemmove{
  \draw[
    fill=purple,
    draw=purple,
    fill opacity=.2,
    rounded corners=2pt
  ]
    ([xshift=-3pt,yshift=-3pt]R.south west)
    rectangle
    ([xshift=4pt,yshift=3pt]R.north east)   node[xshift=0pt,yshift=5pt,above,opacity=1,orientation]{R Group (Side Chain)};
}
 
\chemmove{
  \draw[
    fill=cyan,
    draw=cyan,
    fill opacity=.1,
    rounded corners=2pt
  ]
    ([xshift=-6pt,yshift=-15pt]AL.south west) node[xshift=15pt,yshift=-6pt,below,opacity=1,orientation]{Amino Group}
    rectangle
    ([xshift=3pt,yshift=35pt]AR.north east)
;
}
 
\chemmove{
  \draw[
    fill=cyan,
    draw=cyan,
    fill opacity=.1,
    rounded corners=2pt
  ]
    ([xshift=-3pt,yshift=-39pt]CL.south west) node[xshift=24pt,yshift=-6pt,below,opacity=1,orientation]{Carboxyl Group}
    rectangle
    ([xshift=12pt,yshift=12pt]CR.north east)
;
}

Glycine

For glycine, the R-group is a single hydrogen atom.

Rendered by QuickLaTeX.com

1
2
3
4
5
6
7
8
9
10
11
12
13
14
15
16
17
18
19
20
21
22
23
24
25
26
27
28
29
30
\chemfig{
C(-[:0]C(-[:0]@{C}O^{-})(=[:270]O))
(-[:270]H)(-[:180]H_3N^{+}(-[:270,1,,,draw=none]@{A}))
(-[:90]@{R}H)
}
 
\chemmove{
  \draw[
    fill=purple,
    draw=purple,
    fill opacity=.2,
    rounded corners=2pt
  ]
    ([xshift=-3pt,yshift=-3pt]R.south west)
    rectangle
    ([xshift=4pt,yshift=3pt]R.north east) ;
}
 
\chemmove{
  \draw[
    fill=cyan,
    draw=cyan,
    fill opacity=.1,
    rounded corners=2pt
  ]
    ([xshift=-9pt,yshift=-7pt]A.south west)
    rectangle
    ([xshift=3pt,yshift=5pt]C.north east)
;
}

Alanine

The R-group for alanine is a little more complex than that of glycine, consisting of a methyl group instead of a hydrogen atom.

Rendered by QuickLaTeX.com

1
2
3
4
5
6
7
8
9
10
11
12
13
14
15
16
17
18
19
20
21
22
23
24
25
26
27
28
29
30
\chemfig{
C(-[:0]C(-[:0]@{C}O^{-})(=[:270]O))
(-[:270]H)(-[:180]H_3N^{+}(-[:270,1,,,draw=none]@{A}))
(-[:90]@{RL}CH_{3})
}
 
\chemmove{
  \draw[
    fill=purple,
    draw=purple,
    fill opacity=.2,
    rounded corners=2pt
  ]
    ([xshift=-3pt,yshift=-5pt]RL.south west)
    rectangle
    ([xshift=16pt,yshift=3pt]RL.north east) ;
}
 
\chemmove{
  \draw[
    fill=cyan,
    draw=cyan,
    fill opacity=.1,
    rounded corners=2pt
  ]
    ([xshift=-9pt,yshift=-7pt]A.south west)
    rectangle
    ([xshift=3pt,yshift=5pt]C.north east)
;
}

Valine

Rendered by QuickLaTeX.com

1
2
3
4
5
6
7
8
9
10
11
12
13
14
15
16
17
18
19
20
21
22
23
24
25
26
27
28
29
30
\chemfig{
C(-[:0]C(-[:0]@{C}O^{-})(=[:270]O))
(-[:270]H)(-[:180]H_3N^{+}(-[:270,1,,,draw=none]@{A}))
(-[:90]CH(-[:135]CH_{3})(-[:45]@{RR}CH_{3})(-[:180,1,,,draw=none]@{RL}))
}
 
\chemmove{
  \draw[
    fill=purple,
    draw=purple,
    fill opacity=.2,
    rounded corners=2pt
  ]
    ([xshift=-9pt,yshift=-9pt]RL.south west)
    rectangle
    ([xshift=15pt,yshift=6pt]RR.north east) ;
}
 
\chemmove{
  \draw[
    fill=cyan,
    draw=cyan,
    fill opacity=.1,
    rounded corners=2pt
  ]
    ([xshift=-9pt,yshift=-7pt]A.south west)
    rectangle
    ([xshift=3pt,yshift=5pt]C.north east)
;
}

Leucine

Rendered by QuickLaTeX.com

1
2
3
4
5
6
7
8
9
10
11
12
13
14
15
16
17
18
19
20
21
22
23
24
25
26
27
28
29
30
\chemfig{
C(-[:0]C(-[:0]@{C}O^{-})(=[:270]O))
(-[:270]H)(-[:180]H_3N^{+}(-[:270,1,,,draw=none]@{A}))
(-[:90]CH_{2}((-[:90]CH(-[:135]CH_{3})(-[:45]@{RR}CH_{3})))(-[:180,1,,,draw=none]@{RL}))
}
 
\chemmove{
  \draw[
    fill=purple,
    draw=purple,
    fill opacity=.2,
    rounded corners=2pt
  ]
    ([xshift=-9pt,yshift=-9pt]RL.south west)
    rectangle
    ([xshift=15pt,yshift=9pt]RR.north east) ;
}
 
\chemmove{
  \draw[
    fill=cyan,
    draw=cyan,
    fill opacity=.1,
    rounded corners=2pt
  ]
    ([xshift=-9pt,yshift=-7pt]A.south west)
    rectangle
    ([xshift=3pt,yshift=5pt]C.north east)
;
}

Isoleucine

Rendered by QuickLaTeX.com

1
2
3
4
5
6
7
8
9
10
11
12
13
14
15
16
17
18
19
20
21
22
23
24
25
26
27
28
29
30
\chemfig{
C(-[:0]C(-[:0]@{C}O^{-})(=[:270]O))
(-[:270]H)(-[:180]H_3N^{+}(-[:270,1,,,draw=none]@{A}))
(-[:90]CH(-[:180]@{RL}H_3C)(-[:90]CH_{2}(-[:90]@{RR}CH_{3})))
}
 
\chemmove{
  \draw[
    fill=purple,
    draw=purple,
    fill opacity=.2,
    rounded corners=2pt
  ]
    ([xshift=-6pt,yshift=-9pt]RL.south west)
    rectangle
    ([xshift=18pt,yshift=9pt]RR.north east) ;
}
 
\chemmove{
  \draw[
    fill=cyan,
    draw=cyan,
    fill opacity=.1,
    rounded corners=2pt
  ]
    ([xshift=-9pt,yshift=-7pt]A.south west)
    rectangle
    ([xshift=3pt,yshift=5pt]C.north east)
;
}

Methionine

Rendered by QuickLaTeX.com

1
2
3
4
5
6
7
8
9
10
11
12
13
14
15
16
17
18
19
20
21
22
23
24
25
26
27
28
29
30
\chemfig{
C(-[:0]C(-[:0]@{C}O^{-})(=[:270]O))
(-[:270]H)(-[:180]H_3N^{+}(-[:270,1,,,draw=none]@{A}))
(-[:90]@{RL}CH_{2}(-[:90]CH_{2}(-[:90]S(-[:90]@{RR}CH_{3}))))
}
 
\chemmove{
  \draw[
    fill=purple,
    draw=purple,
    fill opacity=.2,
    rounded corners=2pt
  ]
    ([xshift=-6pt,yshift=-9pt]RL.south west)
    rectangle
    ([xshift=18pt,yshift=9pt]RR.north east) ;
}
 
\chemmove{
  \draw[
    fill=cyan,
    draw=cyan,
    fill opacity=.1,
    rounded corners=2pt
  ]
    ([xshift=-9pt,yshift=-7pt]A.south west)
    rectangle
    ([xshift=3pt,yshift=5pt]C.north east)
;
}

Phenylalanine

Rendered by QuickLaTeX.com

1
2
3
4
5
6
7
8
9
10
11
12
13
14
15
16
17
18
19
20
21
22
23
24
25
26
27
28
29
30
\chemfig{
C(-[:0]C(-[:0]@{C}O^{-})(=[:270]O))
(-[:270]H)(-[:180]H_3N^{+}(-[:270,1,,,draw=none]@{A}))
(-[:90]@{RL}CH_{2}(-[:90]*6(-=-@{RR}=-=)))
}
 
\chemmove{
  \draw[
    fill=purple,
    draw=purple,
    fill opacity=.2,
    rounded corners=2pt
  ]
    ([xshift=-33pt,yshift=-9pt]RL.south west)
    rectangle
    ([xshift=36pt,yshift=6pt]RR.north east) ;
}
 
\chemmove{
  \draw[
    fill=cyan,
    draw=cyan,
    fill opacity=.1,
    rounded corners=2pt
  ]
    ([xshift=-9pt,yshift=-7pt]A.south west)
    rectangle
    ([xshift=3pt,yshift=5pt]C.north east)
;
}

Tryptophan

This was definitely the hardest of the amino acids to draw so far. It took multiple attempts to get the ring structure correct. I also had a problem rendering the full image (the top was being cropped off). I actually have an invisible structure embedded in the page code that serves as a workaround to getting the full image rendered.

Rendered by QuickLaTeX.com

1
2
3
4
5
6
7
8
9
10
11
12
13
14
15
16
17
18
19
20
21
22
23
24
25
26
27
28
29
30
31
32
33
\chemfig{
C(-[:0]C(-[:0]@{C}O^{-})(=[:270]O))
(-[:270]H)(-[:180]H_3N^{+}(-[:270,1,,,draw=none]@{A}))
(-[:90]@{RL}CH_{2}(-[:90]?(*6([::-30]=-NH-(*6(--@{RR}----))=?))))
}
 
\chemmove{
  \draw[
    fill=purple,
    draw=purple,
    fill opacity=.2,
    rounded corners=2pt
  ]
    ([xshift=-33pt,yshift=-9pt]RL.south west)
    rectangle
    ([xshift=36pt,yshift=6pt]RR.north east) ;
}
 
\chemmove{
  \draw[
    fill=cyan,
    draw=cyan,
    fill opacity=.1,
    rounded corners=2pt
  ]
    ([xshift=-9pt,yshift=-7pt]A.south west)
    rectangle
    ([xshift=3pt,yshift=5pt]C.north east)
;
}
\chemfig{
-[:90,1,,,draw=none](-[:90,1,,,draw=none])
}

Proline

Rendered by QuickLaTeX.com

1
2
3
4
5
6
7
8
9
10
11
12
13
14
15
16
17
18
19
20
21
22
23
24
25
26
27
28
29
30
\chemfig{
C(-[:0]C(-[:0]@{C}O^{-})(=[:270]O))
(-[:270]H)(-[:180]H_3N^{+}(-[:270,1,,,draw=none]@{A})(-[:90]@{RL}H_{2}C?))
(-[:90]CH_{2}(-[:120]@{RR}CH_{2}?))
}
 
\chemmove{
  \draw[
    fill=purple,
    draw=purple,
    fill opacity=.2,
    rounded corners=2pt
  ]
    ([xshift=-3pt,yshift=-9pt]RL.south west)
    rectangle
    ([xshift=42pt,yshift=9pt]RR.north east) ;
}
 
\chemmove{
  \draw[
    fill=cyan,
    draw=cyan,
    fill opacity=.1,
    rounded corners=2pt
  ]
    ([xshift=-9pt,yshift=-7pt]A.south west)
    rectangle
    ([xshift=3pt,yshift=5pt]C.north east)
;
}

Posted in: Uncategorized / Tagged: acid, amino, chemfig, LaTeX, structural formula

No. 88: Communicating Mathematics via LaTeX

17 June, 2013 8:40 PM / Leave a Comment / Gene Dan

I started learning LaTeX a couple of years ago, but it wasn’t until last year when I started studying for actuarial exams 4/C and 3/MFE that I really started to become proficient at using it. If you are not familiar with what LaTeX is, it’s a markup language that lets you easily (although it takes some effort to learn) write mathematical formulas on a computer screen by using the keyboard. For example, \[ f(x) = \frac{1}{\sigma\sqrt{2\pi}}\mathrm{e}^{-\frac{(x-\mu)^2}{2\sigma^2}} !\], which is the code written in the WordPress editor, produces the formula for the Normal Distribution:

\[ f(x) = \frac{1}{\sigma\sqrt{2\pi}}\mathrm{e}^{-\frac{(x-\mu)^2}{2\sigma^2}} \]

You can try to write the above formula by using Microsoft Equation editor (like many of us did as highschoolers), but you’ll quickly realize that it takes an extremely long time, and you’ll be wishing that you had a faster, more efficient way of writing mathematical notation – this is where the usefulness of LaTeX becomes apparent.

I started using LaTeX while posting in the actuarial message boards, which are popular amongst candidates who are trying to study for exams. The bulletin board system has a LaTeX compiler installed, so you can easily consult other students from all across the world. For example, if I’m studying at 2:00 AM in the morning, I can post a question on the message board and there will most likely be someone who is awake at that time in Europe or China who would be willing to answer that question.

There are some more well-known message boards as well, such as StackOverflow and MathOverflow, where people (mostly from technical backgrounds) ask each other questions. Oftentimes they’ll use LaTeX to write technical notation – which greatly facilitates communication. I’ve found StackOverflow to be very helpful from time to time. On the other hand, I can’t even understand most of the questions being asked in MathOverflow, which is an online community of mathematicians asking each other research-level questions pertaining to mathematics. Fortunately, there’s another site under the StackExchange umbrella called Mathematics Stack Exachange, which caters to undergraduate and early graduate-level students, and is much more accessible. These websites are only 4 years old and have already made a huge impact on the way people collaborate on technical projects. I’m not sure if Don Knuth imagined this when he invented TeX way back in 1978, but if he did, he had tremendous foresight.

I’ll close by demonstrating a problem on matrices, which I started studying last week. I covered the basic row operations on matrices and today I just went over spanning and matrix equations in the Ax=b form. It’s been very interesting going back to material that I first learned 5 years ago – I have a different perspective now and it’s much like watching a movie – you always pick up something new the second time around.

Problem:

Solve the system of equations:

\[\begin{aligned} x_1 – 3x_3 &= 8 \\ 2x_1 + 2x_2 +9x_3 &= 7 \\ x_2 + 5x_3 &= -2 \end{aligned}\]

Solution:

We’ll start by writing the augmented matrix of this system of equations:

\[\left[ \begin{array}{rrrr} 1 & 0 & -3 & 8 \\ 2 & 2 & 9 & 7 \\ 0 & 1 & 5 & -2 \end{array} \right] \]

Replace row 2 with the sum of row 2 and negative 2 times row 1:

\[\left[ \begin{array}{rrrr} 1 & 0 & -3 & 8 \\ 0 & 2 & 15 & -9 \\ 0 & 1 & 5 & -2 \end{array} \right] \]

Interchange rows 2 and 3:

\[\left[ \begin{array}{rrrr} 1 & 0 & -3 & 8 \\ 0 & 1 & 5 & -2 \\ 0 & 2 & 15 & -9 \end{array} \right] \]

Replace row 3 with the sum of row 3 and negative 2 times row 2:

\[\left[ \begin{array}{rrrr} 1 & 0 & -3 & 8 \\ 0 & 1 & 5 & -2 \\ 0 & 0 & 5 & -5 \end{array} \right] \]

Scale row 3 by 1/5:

\[\left[\begin{array}{rrrr} 1 & 0 & -3 & 8 \\ 0 & 1 & 5 & -2 \\ 0 & 0 & 1 & -1 \end{array} \right] \]

Replace row 2 with the sum of row 2 and negative 5 times row 3:

\[\left[\begin{array}{rrrr} 1 & 0 & -3 & 8 \\ 0 & 1 & 0 & 3 \\ 0 & 0 & 1 & -1 \end{array} \right] \]

Replace row 1 with the sum of row 1 and three times row 3:

\[\left[\begin{array}{rrrr} 1 & 0 & 0 & 5 \\ 0 & 1 & 0 & 3 \\ 0 & 0 & 1 & -1 \end{array} \right] \]

This final matrix is equivalent to the following system of equations:

\[\begin{aligned} x_1 &= 5 \\ x_2 &= 3 \\ x_3 &= -1 \end{aligned} \]

Thus the solution set is \((5,3,-1)\)

The example above is how I would typically ask or answer a question posted on a bulletin board. Actually, giving out the entire solution (as above) is typically frowned upon and most people just give enough hints so that the person who asked the question can figure it out on their own. However, you can definitely see from the example that LaTeX allows you to cleanly print the matrices, which makes it much easier to understand. I remember back in high school when my friends and I would struggle trying to help each other out via AIM or some other chat client. I only wish I’d found out about LaTeX sooner.

Posted in: Logs, Mathematics / Tagged: LaTeX, mathoverflow, matrices, matrix, row operations, stackoverflow

No. 81: A Brief Introduction to Sweave

22 January, 2013 3:08 AM / Leave a Comment / Gene Dan

Hey everyone,

I’ve been using RStudio more regularly at work, and last week I discovered a useful feature called Sweave that allows me to embed R code within a LaTeX document. As the PDF is being compiled, the R code is executed and the results are inserted into the document, creating publication-quality reports. To see what I mean, take a look at the following code:

[code language=”R”]documentclass{article}
usepackage{parskip}
begin{document}
SweaveOpts{concordance=TRUE}

Hello,\\
Let me demonstrate some of the capabilities of Sweave. Here are the first 20 rows of a data frame depicting temperatures in New York City. I can first choose to output the code without evaluating it:

<<eval=false>>=
library(‘UsingR’)
five.yr.temperature[1:20,]
@

and then evaluate the preceding lines with the output following this sentence:

<<echo=false>>=
library(‘UsingR’)
five.yr.temperature[1:20,]
@
end{document}

[/code]

After compilation, the resulting PDF looks like this:

sweave1View PDF

Within a Sweave document, the embedded R code is nested within sections called “code chunks”, the beginning of which are indicated with the characters $latex <<>>=$ , and the end of which are indicated with the character $latex @$. The above example contains two code chunks, one to print the R input onto the document without evaluating it, and the second to print the R output without printing the R input. This is achieved by using the options “eval=false” and “echo=true”. The option eval specifies whether or not the R code should be evaluated, and the option echo specifies whether the R input should be displayed onto the PDF.

Sweave also has the capability to print graphics onto your PDF. The following example applies three different smoothing techniques to a dataset containing temperatures in New York City, and then plots the results in a scatter plot:

[code language=”R”]

documentclass{article}
usepackage{parskip}
begin{document}
SweaveOpts{concordance=TRUE}

Here’s a chart depicting three different smoothing techniques on a dataset. Below, you’ll see some R input, along with the resulting diagram:
<<fig=true>>=
library(‘UsingR’)
attach(five.yr.temperature)
scatter.smooth(temps~days,col=”light blue”,bty=”n”)
lines(smooth.spline(temps~days),lty=2,lwd=2)
lines(supsmu(days, temps),lty=3,lwd=2)
legend(x=110,y=40,lty=c(1,2,3),lwd=c(1,2,2),
legend=c(“scatter.smooth”,”smooth.spline”,”supsmu”))
detach(five.yr.temperature)
@

end{document}

[/code]

sweave2

View PDF

Pretty neat, right? I’d have to say that I’m extremely impressed with RStudio’s team, and their platform has made both R and LaTeX much more enjoyable for me to use. From the above examples, we can conclude that there are at least two benefits from using Sweave:

  1. There’s no need to save images, or copy and paste output into a separate file. Novice users of R would likely generate the R output in a separate instance of R, copy both the R input and output into a textfile, and then copy those pieces into a final report. This process is both time consuming and error prone.
  2. The R code is evaluated when the LaTeX document is compiled, and this means that both the R input and R output within the file report correspond to each other. This greatly reduces the frequency of errors, and increases the consistency of the code you see in the final report.

Because of this, I’ve found Sweave to be extremely useful on the job, especially in the documentation of code.

Additional Resources
The code examples that you see above use data provided from a book that I’m currently working through, Using R for Introductory Statistics. The book comes with its own package called ‘UsingR’ which contains several data sets that are used in its exercises. Sweave has an official instruction manual, which can be found on it’s official home page, here. I found the manual to be quite technical, and I believe it might also be difficult for people who are not thoroughly familiar with the workings of LaTeX. I believe the key to learning Sweave is to simply learn the noweb syntax and to experiment with adjusting the code-chunk options yourself.

noweb
An article on Sweave from RNews
A tutorial by Nicola Sartori
The Joy of Sweave by Mario Pineda-Krch
More links from UMN
An article from Revolution Analytics

sweave3

Posted in: Logs, Mathematics / Tagged: LaTeX, R, R LaTeX integration, RStudio, Statistics, Sweave

No. 41: Project No. 1 – An Eternal Memory Bank via LaTeX; Project No. 2 – RStudio via Linux Server

27 December, 2011 5:55 AM / 3 Comments / Gene Dan

Hey everyone,

Let me introduce you to a couple of projects that I began working on over the last week – a memory bank written in LaTeX and a Linux server hosting RStudio for my predictive modeling projects. I started working on these tasks in order to give myself challenges that would develop my skills, because I had noticed that after I graduated college, the sudden scarcity of drilling, testing, and intellectually stimulating tasks other than actuarial exams or projects at work led to what I felt was a lack of cognitive development, creative activity, and perhaps even a decline in my working memory. This doesn’t mean that I hadn’t done anything in the meantime, however. Over the past year I’ve continued my studies at a pace of around 14-20 hours per week reading things that I found interesting. For instance, I’ve been reading a book on European History because I never got the chance to take a course on it in high school or college. I think over the past year I may have studied more hours than I had in any year of my life. During exam time, I studied a year’s worth of material on Life Contingencies in a span of 3 months. However, I’ve realized that studying can only get you so far. I’ve heard countless times that you have to put down the books if you want to get good at something – you cannot, for instance, learn to ride a bike by reading a book on riding a bike – you actually have to get yourself on a bicycle, ride, fall down, learn from your mistakes, and try again. Thus, I decided to begin a series of projects in order to actively learn by creating. In this way, I hope to keep myself sharp, motivated, and most importantly, intellectually fulfilled.

Project 1: Eternal Memory Bank

I haven’t forgotten about $latex LaTeX$, the markup language that I set about learning around this time last year, though I have forgotten much of the syntax I need to typeset mathematical notation. Unfortunately, using LaTeX via WordPress, as I had done last year, presents some significant drawbacks due to syntactical differences and the fact that I can’t develop my typesetting skills further if I only use LaTeX within my blog. Thus, I’ve decided to construct a memory bank as a complete LaTeX document that you can print out as a book. I first had to start out by learning all the things I forgot over the last year by reading Kopka and Daly’s Guide to LaTeX, at an extremely slow pace – sometimes as slow as 5 pages per minute – though fortunately, it does has some very good exercises. For instance, the following table took me more than an hour to produce:

An excercise in constructing arrays and adjusting formulas

By means of the following input:

[sourcecode]
documentclass{article}
newcommand{D}{displaystyle}
newcommand{bm}{boldmath}
newcommand{ba}{begin{array}}
newcommand{ea}{end{array}}
begin{document}
[ ba{|c|c|c|} hline
multicolumn{3}{|c|}{rule[-2mm]{0mm}{6mm}mbox{Equations for the tangential plane and surface normal}} \ hline
mbox{Equation} & & \
mbox{for the} & mbox{ Tangential plane} & mbox{Surface normal} \
mbox{surface} & & \ hline
F(x,y,z)=0 &ba[t]{r@{{}+{}}l}
D{frac{partial F}{partial x}}(X-x) & rule[0mm]{0mm}{8mm} D{frac{partial F}{partial y}}(Y-y) \[4mm]
& D{frac{partial F}{partial z}}(Z-z)=0
ea & ba[t]{r@{{}={}}c@{{}={}}l}
D{frac{X-x}{D{frac{partial F}{partial x}}}} & D{frac{Y-y}{D{frac{partial F}{partial y}}}} & D{frac{Z-z}{D{frac{partial F}{partial z}}}}
ea \[13mm]
z=f(x,y) & Z-z =p(X-x)+q(Y-y) &D{frac{X-x}{p}=frac{Y-y}{q} = frac{Z-z}{-1}} \[4mm]
ba{c}
x=x(u,v)\
y=y(u,v)\
z=z(u,v)\ ea &
left|ba{ccc}
X-x & Y-y & Z-z\
D{frac{partial x}{partial u}} & D{frac{partial y}{partial u}} & D{frac{partial z}{partial u}}\[3mm]
D{frac{partial x}{partial v}} & D{frac{partial y}{partial v}} & D{frac{partial z}{partial v}}\ ea right| = 0 &
ba{r@{{}={}}l}
D{frac{X-x}{left|ba{cc}
frac{partial y}{partial z} & frac{partial z}{partial u}\[1mm]
frac{partial y}{partial v} & frac{partial z}{partial v} ea right|}} &
D{frac{Y-y}{left|ba{cc}
frac{partial z}{partial u} & frac{partial x}{partial u}\[1mm]
frac{partial z}{partial v} & frac{partial x}{partial v} ea right|}}\[10mm]
& D{frac{Z-z}{left|ba{cc}
frac{partial x}{partial u} & frac{partial y}{partial u}\[1mm]
frac{partial x}{partial v} & frac{partial y}{partial v} \ ea right|}} ea \[15mm]
rule[-5mm]{0mm}{0mm}mbox{boldmath{$r=r$}}(u,v) & ba{r@{{}={}}l}
mbox{boldmath{$(R-r)(r_1times r_2)$}} & 0\
mbox{or} hfill mbox{boldmath{$(R-r)N$}} & 0\ ea & ba{r@{{}+{}}l}
mbox{boldmath{$R=r$}} & mbox{boldmath{$lambda(r_1times r_2)$}} \
mbox{or boldmath{$R=r$}} & mbox{boldmath{$lambda N$}}ea \ hline
multicolumn{3}{|c|}{rule[0mm]{0mm}{10mm}parbox{116mm}{In this table, $x,y,z$ and $mathbf{r}$ are the coordinates and the radius vector of a fixed point $M$ on the curve; $X,Y,Z,$ and $mathbf{R}$ are the coordinates and radius vector of a point on the tangential plane or surface normal with reference to $M$; furthermore, $p =frac{partial z}{partial x}, q=frac{partial z}{partial y}$ and $mathbf{r_1}=mathbf{frac{partial r}{partial mathnormal{u}}, r_2=frac{partial r}{partial mathnormal{v}}}$.}}\ hline
ea ]
end{document}[/sourcecode]

As you can see, the code does not look pretty. Fortunately, on another go I believe I can reproduce the above table in about 15 minutes, and perhaps even faster on the third try.

Anyway, I began putting the pieces of my Eternal Memory Bank a couple weeks ago and spent the last couple of weeks putting what little I had together for this post. If you’ve taken a look at my Projects page, you can see that I’ve been learning College Algebra over the last few months – not because I don’t know algebra but because I felt that I needed to fill in a few gaps left behind by my inadequate high school education, and because I’ve forgotten a lot since then and I thought perhaps that I could get some new insight by revisiting an old subject. I decided to extract a few pieces of information that I really ought not to forget – and put them into this memory bank to commit to memory, forever. You can download the pdf from my SkyDrive here and the TeX file here.

An excerpt from the Preface:

“Hey everyone,

I’ve decided to construct an eternal memory bank, within which I’ve placed
select pieces of information that I’ve deemed important enough to commit to
memory, forever. This document serves as a visual representation of these
pieces in written form. I’ve undertaken this seemingly somewhat tedious and
arbitrary project to keep my memory in shape and because I’m sick and tired
of forgetting the formula to (a+b)^3 and having to either work out the expan-
sion every time it shows up (usally once in a blue moon for me) or look it up (I
usually work out the expansion out of pride, or just use the bionomial theorem).
In other words, these things take up precious time and I would much rather be
able to pull them immediately from memory than to rely on something that
may be in another book in some distant library or buried underneath mounds
of links in a website like Wikipedia.

Let me stress that I am not relying on memory for all of my tasks – that would
be ridiculously insane. You cannot solve complex problems on rote memory
alone becuase they require creativity and higher-level analytical skills. On the
other hand, there are some things you absolutely must memorize – for instance
as I write I am pulling out every single word on this page by memory. You can
gure out some words with context clues and associations, but if you have to
do that with every word during a conversation that is also absolutely, insanely
ridiculous.

So, welcome to my Eternal Memory Bank. Everything you see here, including
the fonts, document structure, Table of Contents – I guarantee you I’ve memo-
rized it. So, take a look, give me feedback if you wish, and enjoy.”

Project 2: RStudio via Linux Server

My second project began as a side project to my real job when my boss recommended that I check out Kaggle and sign up for their predictive modeling competitions. For those of you who don’t know, the website Kaggle hosts a series of predictive modelling competitions and awards cash prizes to the winners. The competitors include PhD-level academics, statisticians, mathematicians, hobbyists, and actuaries like me. I think of this as an excellent opportunity to see how the experts operate – the cash prize merely serves as icing on the cake, and I don’t really have the ambition to go for the top prize as of now.

To set up a base for myself and the rest of my team members, I decided to construct a Linux server out of an old computer I had laying around – it has some new components though, like an Athlon II x4 processor and plenty of RAM – 8GB. The server currently operates on ubuntu 11.10 “Oneric Ocelot,”  though I may change my mind and set up an ssh server using Ubuntu Server instead. In addition to the Ubuntu, I set up my Windows machine in a way that lets me control the Ubuntu Server remotely – including shutting down, turning on, logging in etc.

Logging into the server remotely with Tight VNC

After installing the server I downloaded RStudio server, a GUI developed by a group of volunteer programmers that allows people to connect to R remotely through their own Windows machines. In this manner I hope that my teammates and I can collaborate on our projects. I first asked some of my friends to try logging in but they couldn’t do it – so I asked my more technically savvy friends what to do and they suggested that I set up a static IP and forward port 8787 on my router. After doing so, they successfully logged in! Now I, or anyone on my team can access the server anywhere with an internet connection – hotels, coffee shops, etc.

Connecting to the RStudio GUI though Firefox on my Windows machine

Well that’s pretty much it, I have to say I’m happy that I posted this week as promised. I used to have trouble with these things as a kid but I feel that I’ve stayed on task much better as an adult. One study claims that it’s because kids have too much grey matter. My dad once said that “smart people just explain things away” when I tried giving him excuse one time as to why I forgot to replace the window stickers inside my car last year. I had trouble understanding what he meant but I think he meant that when scientists come up with explanations for these phenomena (in this case, why kids can’t stay on task), people use these explanations as excuses for their bad behavior. Thanks, Dad. Stay tuned for next week’s posting!

Posted in: Logs / Tagged: Kaggle, LaTeX, Remote Desktop, RStudio, Ubuntu

Archives

  • September 2023
  • February 2023
  • January 2023
  • October 2022
  • March 2022
  • February 2022
  • December 2021
  • July 2020
  • June 2020
  • May 2020
  • May 2019
  • April 2019
  • November 2018
  • September 2018
  • August 2018
  • December 2017
  • July 2017
  • March 2017
  • November 2016
  • December 2014
  • November 2014
  • October 2014
  • August 2014
  • July 2014
  • June 2014
  • February 2014
  • December 2013
  • October 2013
  • August 2013
  • July 2013
  • June 2013
  • March 2013
  • January 2013
  • November 2012
  • October 2012
  • September 2012
  • August 2012
  • July 2012
  • June 2012
  • May 2012
  • April 2012
  • March 2012
  • February 2012
  • January 2012
  • December 2011
  • September 2011
  • August 2011
  • July 2011
  • June 2011
  • January 2011
  • December 2010
  • October 2010
  • September 2010
  • August 2010
  • June 2010
  • May 2010
  • April 2010
  • March 2010
  • September 2009
  • August 2009
  • May 2009
  • December 2008

Categories

  • Actuarial
  • Cycling
  • Logs
  • Mathematics
  • MIES
  • Music
  • Uncategorized

Links

Cyclingnews
Jason Lee
Knitted Together
Megan Turley
Shama Cycles
Shama Cycles Blog
South Central Collegiate Cycling Conference
Texas Bicycle Racing Association
Texbiker.net
Tiffany Chan
USA Cycling
VeloNews

Texas Cycling

Cameron Lindsay
Jacob Dodson
Ken Day
Texas Cycling
Texas Cycling Blog
Whitney Schultz
© Copyright 2025 - Gene Dan's Blog
Infinity Theme by DesignCoral / WordPress