• Home
  • Readings
  • Github
  • MIES
  • TmVal
  • About
Gene Dan's Blog

Tag Archives: R

No. 99: Eratosthenes’ Sieve

26 August, 2013 8:29 PM / Leave a Comment / Gene Dan

A friend of mine pointed out that I had skipped a few steps in the solution I posted yesterday for Euler #3 – first, I didn’t actually go through the process of finding the primes, and second, I didn’t try to figure out how many prime numbers would be necessary for the list I used to find the largest prime factor of 600,851,475,143. To rectify these issues, I wrote another program that can provide the general solution for any integer larger than 1:

1
2
3
4
5
6
7
8
9
10
11
12
13
prime <- 2
primes <-c()
remaining.factor <- 600851475143
while(prime != remaining.factor){
  while(remaining.factor %% prime ==0){
    remaining.factor <- remaining.factor/prime
  }
  primes <- append(primes,prime)
  while(length(which(prime %% primes ==0)>0)){
    prime <- prime + 1
  }
}
remaining.factor

All you have to do is replace 600,851,475,143 with a number of your choice, and the script above will find the largest prime factor for that number, given enough time and memory. I was actually somewhat lucky that the answer ended up being 6857. Had it been larger, the program might have taken much longer to execute (possibly impractically long if the factor happened to be big enough).

Eratosthenes’ Sieve

Now that I have that out of the way, I would like to demonstrate a method for quickly generating prime numbers, called Eratosthenes’ Sieve. You can embed this algorithm into the solution of any Project Euler problem that calls for a large list of prime numbers under 10 million (after 10 million, the algorithm takes a long time to execute, and other sieves may be a better choice). While it’s possible to generate prime numbers on the fly for Euler problems, I still prefer to use lists to solve them. Below is the algorithm for Eratosthenes’ Sieve that I’ve written in R:

1
2
3
4
5
6
7
8
9
primes <- 2:10000000
 
curr.prime <- 2
while(curr.prime < sqrt(10000000)){
  primes[(primes >= curr.prime **2) & (primes %% curr.prime == 0)] <- 0
  curr.prime <- min(primes[primes>curr.prime])
}
 
primes <- primes[primes!=0]

The script above will generate a list of all the primes below 10,000,000. The algorithm starts with a list of integers from 2 to 10,000,000. Starting with 2, the smallest prime, you remove all the multiples of 2 from the list. Then you move on to the next prime, 3, and remove all the multiples of 3 from the list. The process continues until the only numbers left in the list are prime numbers.

primes2

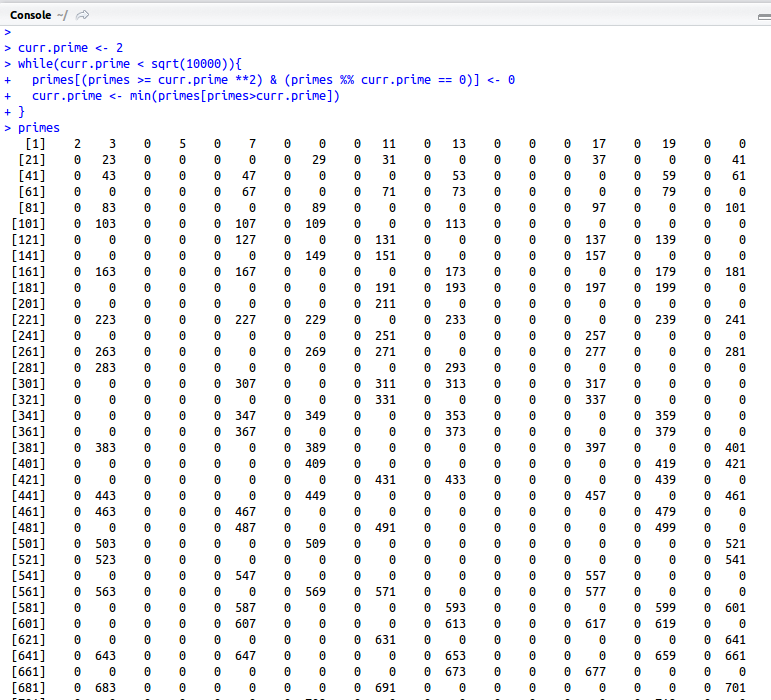
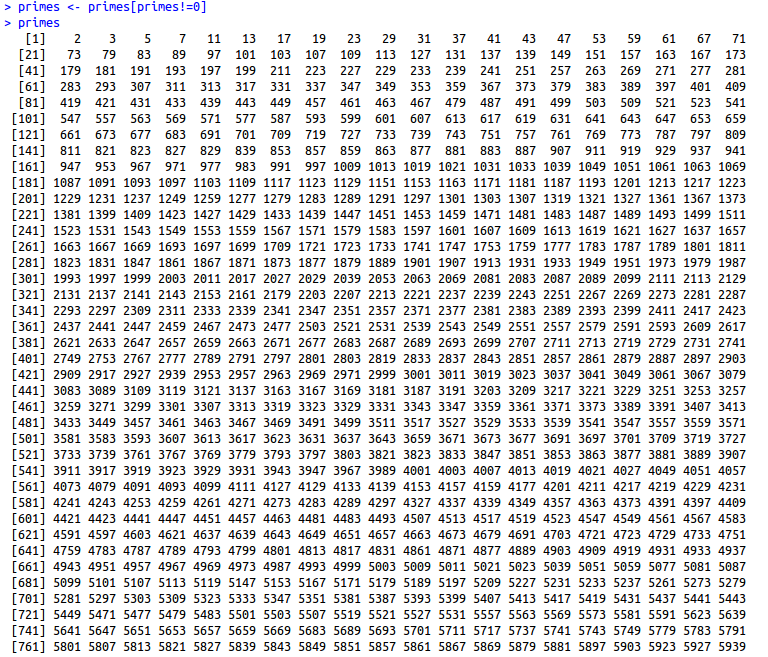
As you can see, all the composite numbers are now marked as zeros. The final line of the script removes these zeros and gives you a list of just the prime numbers.

primes3

Posted in: Mathematics / Tagged: eratosthenes sieve, eratosthenes sieve in r, project euler 3, project euler 3 r, R

No. 97: Project Euler #2 – Even Fibonacci Numbers

19 August, 2013 6:54 PM / Leave a Comment / Gene Dan

Question:

Each new term in the Fibonacci sequence is generated by adding the previous two terms. By starting with 1 and 2, the first 10 terms will be:

1, 2, 3, 5, 8, 13, 21, 34, 55, 89, …

By considering the terms in the Fibonacci sequence whose values do not exceed four million, find the sum of the even-valued terms.

Background:

There are some interesting things to note about Fibonnaci. Students often get their first introduction to the Fibonacci numbers when they first learn about sequences. The popular story is that they were used by Fibonacci to model rabbit populations over a period of time – you start with one pair of rabbits, denoted by 1 as the first term of the sequence. After a month, this pair of rabbits produces another pair, and now the total number of pairs is two. After another month, these two pairs produce another pair, resulting in a total of three pairs after two months. After three months, these three pairs produce 2 additional pairs, resulting in a total of five. The sequence then continues indefinitely, and students are often surprised at how quickly the terms grow.

Beyond the Fibonnaci numbers, there are some more interesting things about the mathematician for whom they are named, and how he fits in with the history of mathematics. While the Fibonacci numbers may be the most widespread way in which people are aware of Fibonacci’s existence, they are not (at least in my opinion), his most important contribution to western mathematics. Although the Fibonacci numbers appear in his book, Liber Abaci, the book itself also introduces the Hindu-Arabic number system, and it was this book that played a crucial role in popularizing the Arabic numerals – the numbers we use today – in western society. Prior to that, Europeans relied on Roman Numerals, which were cumbersome when it came to calculation. Even though the Arabic numerals appeared in Liber Abaci in 1202, it took another 400 years until they became ubiquitous throughout Europe, when the invention of the printing press aided in its widespread adoption.

Approach:

This problem is fairly straightforward. The description already tells you how to calculate the Fibonnaci numbers, and simply asks you to find the sum of the even valued terms which are less than four million. With some time and effort, you could easily do the problem by hand, although there is more educational value beyond simple addition (and efficiency!) if you solve it with a computer program. When I start out on these problems, I first create a mental outline of the solution, typically starting with brute force, and if I realize that a brute force solution would take too long, I try to come up with an indirect approach that may be more efficient. In this case the problem is simple, so I decided to use brute force. Here are steps in my mental outline:

  1. Generate the sequence of all Fibonacci numbers that are less than 4,000,000.
  2. Determine which numbers of the sequence are even numbers, then extract this subset.
  3. Add the subset of these even numbers. This will be the solution.

Solution 1:

1
2
3
4
5
6
7
8
9
x <- c(1,2)
k = 3
i = 3
while(k<=4000000){
  x <- append(x,k)
  k = k + x[i-1]
  i = i +1
}
sum(x[x%%2==0])

For this solution, I first created a vector x containing the first two seed values, 1 and 2. This vector will be used to store the sequence of Fibonnaci numbers under 4 million. Next, I declared variables k and i, starting at 3 to be used as indices in the while loop that is used to calculate the terms of the sequence. I used a while loop because I do not know (at the time of writing the solution) the number of terms that fall below 4 million. The while loop allows me to keep appending terms to the vector x so long as the terms are less than four million. Once the value of the next term exceeds four million, the program exits the loop and moves on to the next line after the loop.

Within the loop itself, you see the line x <- append(x,k). This tells the program to append the value of k=3 to the vector x, or in other words, to append the third term of the Fibonacci sequence. The next line, k = k + x[i-1], sets k equal to its current value plus the value of the second to last element of the vector x (denoted by i-1, since there are currently i elements of the vector x). In other words, set k = 5. Then i = i +1 tells the program to increment i by 1, or in other words, set i equal to 4, which will be used to index the vector x during the loop’s next iteration when there will be four elements in the vector x.

During the next iteration of the loop, k is now equal to 5, i is now equal to 4. Append k to x so that the sequence becomes (1,2,3,5). Then set k = 5+3 = 8. Then set i = 4+1 = 5. The loop continues until all the terms of the Fibonacci sequence under 4 million are contained in x.
The last line of the program tells the computer to take the sum of all the even elements of x. The index[x%%2==0] is a predicate telling the computer to extract the subset of x where 2 divides each element evenly. The %% operator is the modulo operator, which returns the remainder of x and 2. When the remainder is equal to 0, that means 2 divides x evenly. The sum over the subset returned is the answer, 4,613,732.

Solution 2:

1
2
3
4
5
6
7
x <- c(1,2)
k = 3
while(k<=4000000){
  x <- append(x,k)
  k = k + max(x[x<k])
}
sum(x[x%%2==0])

In this solution, I was able to remove the variable i, by noticing that it was sufficient to calculate the next term of the Fibonacci sequence by adding the largest two terms of the vector x. This calculation is represented by the line k = k + max(x[x<k]).

Solution 3:

1
2
3
4
5
x <- c(1,2)
while(max(x)<=4000000){
  x <- append(x,max(x)+max(x[x<max(x)]))
}
sum(x[x%%2==0])

Here, I was able to shorten the solution to five lines by removing the variable k. Here, I tell the the program to simply append to x, the sum of the current largest two values of x. This calculation is represented by the line x <- append(x,max(x)+max(x[x<max(x)])).

Posted in: Logs, Mathematics / Tagged: even fibonacci numbers, fibonacci, fibonacci numbers, project euler #2, project euler 2 R, R

No. 83: Basic Simulation Using R

13 March, 2013 2:00 AM / Leave a Comment / Gene Dan

Today I’d like to demonstrate a few examples of simulation by using R’s built-in pseudorandom number generator. We’ll start by calling the function runif(n), which returns a vector of n draws from the uniform distribution on the interval [0,1]. To see what I mean, runif(50) will return 50 random numbers between 0 and 1 (inclusive):

[code language=”r” wraplines=”FALSE”]> runif(50)
[1] 0.79380213 0.02640186 0.48848994 0.50689348 0.27242565 0.37866590 0.50134423 0.04855088 0.35709235 0.06587394 0.04107046 0.52542577 0.31302174
[14] 0.65262709 0.60967237 0.45131387 0.55305078 0.83903314 0.72698109 0.06292518 0.47579002 0.15186000 0.71345801 0.71252703 0.22304757 0.20179550
[27] 0.57375115 0.06144426 0.87460214 0.87085905 0.52197596 0.79827053 0.35533929 0.23212775 0.30441290 0.29824819 0.59430450 0.92366848 0.63523013
[40] 0.59757710 0.67266388 0.06165364 0.12924342 0.10372910 0.49521401 0.31687057 0.08331765 0.51155404 0.35502189 0.65212223
[/code]

Interestingly, the numbers generated above aren’t actually random. R uses a process called pseudorandom number generation, which uses an algorithm to generate a long string of deterministic digits that appear to be random to most people, unless they have godlike powers of pattern recognition. The algorithm acts upon an initial value, called a seed, and for each seed the algorithm will return the same sequence of numbers. The term period refers to how long the sequence can go before it repeats itself. For example, Microsoft Excel’s PRNG (pseudorandom number generator) has a relatively short period, as (depending on the application) the sequence of numbers will repeat itself unless you frequently re-seed the algorithm. That is, if you generate a sequence 938745…, you’ll see 938745… again without too many draws.

The default PRNG used by R is called the Mersenne Twister, an algorithm developed in 1998 by Matsumoto and Nishimura. Other choices are available, such as Wichman-Hill, Marsaglia-Multicarry, Super-Duper, Knuth-TAOCP, and L’Ecuyer-CMRG. You can even supply your own PRNG, if you wish.

We can plot a histogram of a vector of generated numbers in order to observe the distribution of our sample. Below, you’ll see a 4-plot panel depicting samples from a uniform distribution on [0,1], with different draws per sample:

[code language=”r”]
#Uniform Sampling
par(mfrow=c(2,2))
for(i in 1:4){
x <- runif(10**i)
hist(x,prob=TRUE, col=”grey”,ylim=c(0,2),main = paste(10**i,” Draws”))
curve(dunif(x),add=TRUE,col=”red”,lwd=2)}
[/code]

unif

As you can see, the sample approaches the uniform distribution as the number of draws becomes larger.

Similarly, we can simulate observations from the normal distribution by calling the function rnorm(n,mean,sd), which returns a vector of n draws from the normal distribution with mean=mean and standard deviation = sd:

[code language=”r”]
#Normal Sampling
par(mfrow=c(2,2))
for(i in 1:4){
x <- rnorm(10**i)
hist(x,prob=TRUE,col=”grey”,ylim=c(0,.6),xlim=c(-4,4),main=paste(10**i,” Draws”))
curve(dnorm(x),add=TRUE,col=”red”,lwd=2)}
[/code]

norm4Likewise, as the number of draws gets bigger, the sample approaches the normal distribution.

We can use R to demonstrate the binomial approximation to the normal distribution. The binomial distribution with parameters n and p is approximately normal with mean np and variance np(1-p), with n large and p not too small. We’ll draw from the binomial distribution with n = 50 and p = .5, and then plot a normal curve with mean = 25 and variance = 12.5. Notice that as we increase the number of draws, the histrogram looks more and more like the normal distribution:

[code language=”r”]
#Binomial approximation to Normal
par(mfrow=c(2,2))
n <- 50
p <- .5
for(i in 1:4){
x <- rbinom(10**i,n,p)
hist(x,prob=TRUE,col=”grey”,ylim=c(0,.2),xlim=c(10,40),main=paste(10**i,” Draws”))
curve(dnorm(x,n*p,sqrt(n*p*(1-p))),add=TRUE,col=”red”,lwd=2)}
[/code]

binom_approx

For fun, I decided to see how many simulated values my computer could handle. I created a vector of 1 billion draws from the standard normal distribution:

[code language=”r”]
x<-rnorm(1000000000)
hist(x,prob=TRUE,col=”grey”,main=”1000000000 Draws”)
curve(dnorm(x),add=TRUE,col=”red”,lwd=2)
[/code]

norm5

Which took about 20 minutes to execute, using almost all of my computer’s memory (16 GB). This was unnecessary, as I could have reproduced the image above without as many draws. Nevertheless, I’m very impressed with R’s capabilities, as a similar script would have been impossible in Excel if I wanted to store the numbers in memory, or it would have taken much longer if I had even decided to clear the memory throughout the routine.

Posted in: Logs, Mathematics / Tagged: binomial approximation to normal, prng, pseudo random number generator, pseudorandom number generation, R, random number generator, simulation

No. 82: Plotting Normal Distributions with R

12 March, 2013 3:03 AM / 1 Comment / Gene Dan

Hey everyone,

I’ve got some good news  – I passed CA2 a few weeks ago and I’m glad I was able to knock out that requirement shortly after I passed CA1. The bad news is that I’ve only written three posts this year when I should have had ten, so I’ve got some catching up to do. Over the past couple of months, I’ve mostly been studying material related to the insurance industry, but I try to squeeze in some math or programming whenever I have time. Lately, I’ve been learning how to work with the SQL Server Management Studio interface to aggregate large datasets at work. For statistics, I’ve continued my studies with Verzani’s Using R for Introductory Statistics, which I started reading last year, but put off until this year due to exams. Today, I’d like to show you some of R’s plotting capabilities – we’ll start off with a plot of the standard normal distribution, and I’ll demonstrate how you can change the shape of the plotted distribution by adjusting its parameters.

If you’ve taken statistics, you’re most likely familiar with the normal distribution:

\[ f(x) = \frac{1}{\sigma\sqrt{2\pi}}\mathrm{e}^{-\frac{(x-\mu)^2}{2\sigma^2}} \]

One of the nice things about this distribution is that its two parameters are the mean and variance, which are common statistics used in everyday language. The mean is the average, a measure of central tendency that describes the center of the distribution, and the variance is a statistic that describes the spread of the distribution – how widely the data points deviate from the mean. The following code generates a plot of the density function of a standard normal random variable, and then adds two curves that depict the same distribution shifted to the left:

[code language=”r”]
#Standard normal, then shifted to the left
x <- seq(-6,6,length=500)
plot(x,dnorm(x,mean=0,sd=1),type = “l”,lty=1,lwd=3,col=”blue”,main=”Normal Distribution”,ylim=c(0,0.5),xlim=c(-6,6),ylab=”Density”)
curve(dnorm(x,-1,1),add=TRUE,lty=2,col=”blue”)
curve(dnorm(x,-2,1),add=TRUE,lty=3,col=”blue”)
legend(2,.5,legend=c(“N ~ (0, 1)”,”N ~ (-1, 1)”,”N ~ (-2, 1)”),lty=1:3,col=”blue”)
[/code]

norm1The code first generates a vector of length 500. This vector is then used as an argument to the dnorm() function, which returns the normal density of each element of the input vector. Notice that in line 2, dnorm(x,mean=0,sd=1) is a function with 3 arguments – the first specifies the input vector, the second specifies that the mean of the distribution equals 0, and the third argument specifies that the standard deviation of the distribution equals 1. The function returns a vector of densities which are in turn used as an input to the plot() function, which generates the solid blue line in the above figure. The next two lines of the script add the same distribution shifted 1 and 2 units to the left. You can see that in these two lines, the 2nd argument of the dnorm() function is -1 and -2, respectively – this means that I changed the mean of the distribution to -1 and -2, from 0, causing the leftward shift that you see above.

Similarly, I can shift the distribution to the right by increasing the mean:

[code language=”r”]
#Standard normal, then shifted to the right
x <- seq(-6,6,length=500)
plot(x,dnorm(x,mean=0,sd=1),type = “l”,lty=1,lwd=3,col=”purple”,main=”Normal Distribution”,ylim=c(0,0.5),xlim=c(-6,6),ylab=”Density”)
curve(dnorm(x,1,1),add=TRUE,lty=2,col=”purple”)
curve(dnorm(x,2,1),add=TRUE,lty=3,col=”purple”)
legend(-5.5,.5,legend=c(“N ~ (0, 1)”,”N ~ (1, 1)”,”N ~ (2, 1)”),lty=1:3,col=”purple”)
[/code]

norm2

Notice that I can change the position of the legend by specifying the x and y coordinates in the first two arguments of the legend() function.

The next script keeps the mean at 0, but adds two curves with the standard deviation increased to 1 and 2:

[code language=”r”]
#Standard normal, then increased variance
x <- seq(-6,6,length=500)
plot(x,dnorm(x,mean=0,sd=1),type = “l”,lty=1,lwd=3,col=”black”,main=”Normal Distribution”,ylim=c(0,0.5),xlim=c(-6,6),ylab=”Density”)
curve(dnorm(x,0,1.5),add=TRUE,lty=2,col=”red”)
curve(dnorm(x,0,2),add=TRUE,lty=3,col=”black”)
legend(-5.5,.5,legend=c(“N ~ (0, 1)”,”N ~ (0, 2.25)”,”N ~ (0, 4)”),lty=1:3,col=c(“black”,”red”,”black”))
[/code]

norm3

Here, I made the middle curve red by using the “col” argument in the plot() function. Personally, plotting is one of my favorite things to do with R. I feel that visualizing data helps you gain an intuitive grasp on the subject, and reveals patterns that you might not otherwise see with aggregated tables or simple summary statistics. Later on this week (hopefully tomorrow), I’ll demonstrate some simple simulations with the normal distribution.

Posted in: Logs, Mathematics / Tagged: cran, normal plot r, R

No. 81: A Brief Introduction to Sweave

22 January, 2013 3:08 AM / Leave a Comment / Gene Dan

Hey everyone,

I’ve been using RStudio more regularly at work, and last week I discovered a useful feature called Sweave that allows me to embed R code within a LaTeX document. As the PDF is being compiled, the R code is executed and the results are inserted into the document, creating publication-quality reports. To see what I mean, take a look at the following code:

[code language=”R”]documentclass{article}
usepackage{parskip}
begin{document}
SweaveOpts{concordance=TRUE}

Hello,\\
Let me demonstrate some of the capabilities of Sweave. Here are the first 20 rows of a data frame depicting temperatures in New York City. I can first choose to output the code without evaluating it:

<<eval=false>>=
library(‘UsingR’)
five.yr.temperature[1:20,]
@

and then evaluate the preceding lines with the output following this sentence:

<<echo=false>>=
library(‘UsingR’)
five.yr.temperature[1:20,]
@
end{document}

[/code]

After compilation, the resulting PDF looks like this:

sweave1View PDF

Within a Sweave document, the embedded R code is nested within sections called “code chunks”, the beginning of which are indicated with the characters $latex <<>>=$ , and the end of which are indicated with the character $latex @$. The above example contains two code chunks, one to print the R input onto the document without evaluating it, and the second to print the R output without printing the R input. This is achieved by using the options “eval=false” and “echo=true”. The option eval specifies whether or not the R code should be evaluated, and the option echo specifies whether the R input should be displayed onto the PDF.

Sweave also has the capability to print graphics onto your PDF. The following example applies three different smoothing techniques to a dataset containing temperatures in New York City, and then plots the results in a scatter plot:

[code language=”R”]

documentclass{article}
usepackage{parskip}
begin{document}
SweaveOpts{concordance=TRUE}

Here’s a chart depicting three different smoothing techniques on a dataset. Below, you’ll see some R input, along with the resulting diagram:
<<fig=true>>=
library(‘UsingR’)
attach(five.yr.temperature)
scatter.smooth(temps~days,col=”light blue”,bty=”n”)
lines(smooth.spline(temps~days),lty=2,lwd=2)
lines(supsmu(days, temps),lty=3,lwd=2)
legend(x=110,y=40,lty=c(1,2,3),lwd=c(1,2,2),
legend=c(“scatter.smooth”,”smooth.spline”,”supsmu”))
detach(five.yr.temperature)
@

end{document}

[/code]

sweave2

View PDF

Pretty neat, right? I’d have to say that I’m extremely impressed with RStudio’s team, and their platform has made both R and LaTeX much more enjoyable for me to use. From the above examples, we can conclude that there are at least two benefits from using Sweave:

  1. There’s no need to save images, or copy and paste output into a separate file. Novice users of R would likely generate the R output in a separate instance of R, copy both the R input and output into a textfile, and then copy those pieces into a final report. This process is both time consuming and error prone.
  2. The R code is evaluated when the LaTeX document is compiled, and this means that both the R input and R output within the file report correspond to each other. This greatly reduces the frequency of errors, and increases the consistency of the code you see in the final report.

Because of this, I’ve found Sweave to be extremely useful on the job, especially in the documentation of code.

Additional Resources
The code examples that you see above use data provided from a book that I’m currently working through, Using R for Introductory Statistics. The book comes with its own package called ‘UsingR’ which contains several data sets that are used in its exercises. Sweave has an official instruction manual, which can be found on it’s official home page, here. I found the manual to be quite technical, and I believe it might also be difficult for people who are not thoroughly familiar with the workings of LaTeX. I believe the key to learning Sweave is to simply learn the noweb syntax and to experiment with adjusting the code-chunk options yourself.

noweb
An article on Sweave from RNews
A tutorial by Nicola Sartori
The Joy of Sweave by Mario Pineda-Krch
More links from UMN
An article from Revolution Analytics

sweave3

Posted in: Logs, Mathematics / Tagged: LaTeX, R, R LaTeX integration, RStudio, Statistics, Sweave

Post Navigation

1 2 Next »

Archives

  • September 2023
  • February 2023
  • January 2023
  • October 2022
  • March 2022
  • February 2022
  • December 2021
  • July 2020
  • June 2020
  • May 2020
  • May 2019
  • April 2019
  • November 2018
  • September 2018
  • August 2018
  • December 2017
  • July 2017
  • March 2017
  • November 2016
  • December 2014
  • November 2014
  • October 2014
  • August 2014
  • July 2014
  • June 2014
  • February 2014
  • December 2013
  • October 2013
  • August 2013
  • July 2013
  • June 2013
  • March 2013
  • January 2013
  • November 2012
  • October 2012
  • September 2012
  • August 2012
  • July 2012
  • June 2012
  • May 2012
  • April 2012
  • March 2012
  • February 2012
  • January 2012
  • December 2011
  • September 2011
  • August 2011
  • July 2011
  • June 2011
  • January 2011
  • December 2010
  • October 2010
  • September 2010
  • August 2010
  • June 2010
  • May 2010
  • April 2010
  • March 2010
  • September 2009
  • August 2009
  • May 2009
  • December 2008

Categories

  • Actuarial
  • Cycling
  • Logs
  • Mathematics
  • MIES
  • Music
  • Uncategorized

Links

Cyclingnews
Jason Lee
Knitted Together
Megan Turley
Shama Cycles
Shama Cycles Blog
South Central Collegiate Cycling Conference
Texas Bicycle Racing Association
Texbiker.net
Tiffany Chan
USA Cycling
VeloNews

Texas Cycling

Cameron Lindsay
Jacob Dodson
Ken Day
Texas Cycling
Texas Cycling Blog
Whitney Schultz
© Copyright 2025 - Gene Dan's Blog
Infinity Theme by DesignCoral / WordPress