Hey everyone,
I’ve been using RStudio more regularly at work, and last week I discovered a useful feature called Sweave that allows me to embed R code within a LaTeX document. As the PDF is being compiled, the R code is executed and the results are inserted into the document, creating publication-quality reports. To see what I mean, take a look at the following code:
[code language=”R”]documentclass{article}
usepackage{parskip}
begin{document}
SweaveOpts{concordance=TRUE}
Hello,\\
Let me demonstrate some of the capabilities of Sweave. Here are the first 20 rows of a data frame depicting temperatures in New York City. I can first choose to output the code without evaluating it:
<<eval=false>>=
library(‘UsingR’)
five.yr.temperature[1:20,]
@
and then evaluate the preceding lines with the output following this sentence:
<<echo=false>>=
library(‘UsingR’)
five.yr.temperature[1:20,]
@
end{document}
[/code]
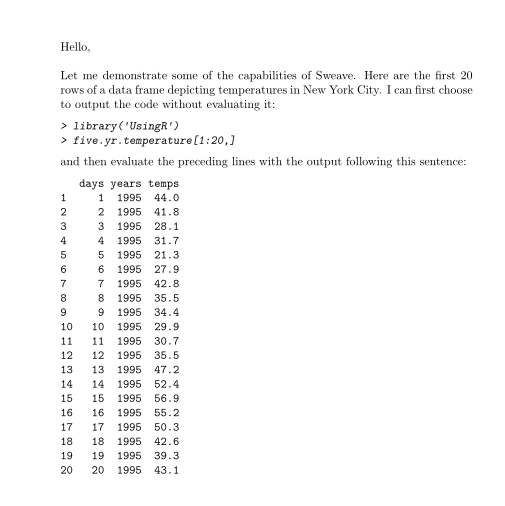
After compilation, the resulting PDF looks like this:
Within a Sweave document, the embedded R code is nested within sections called “code chunks”, the beginning of which are indicated with the characters $latex <<>>=$ , and the end of which are indicated with the character $latex @$. The above example contains two code chunks, one to print the R input onto the document without evaluating it, and the second to print the R output without printing the R input. This is achieved by using the options “eval=false” and “echo=true”. The option eval specifies whether or not the R code should be evaluated, and the option echo specifies whether the R input should be displayed onto the PDF.
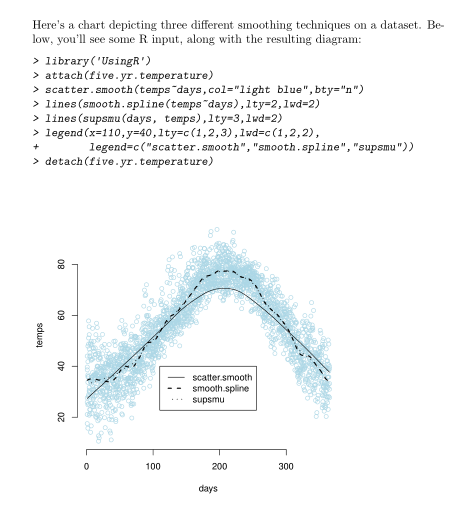
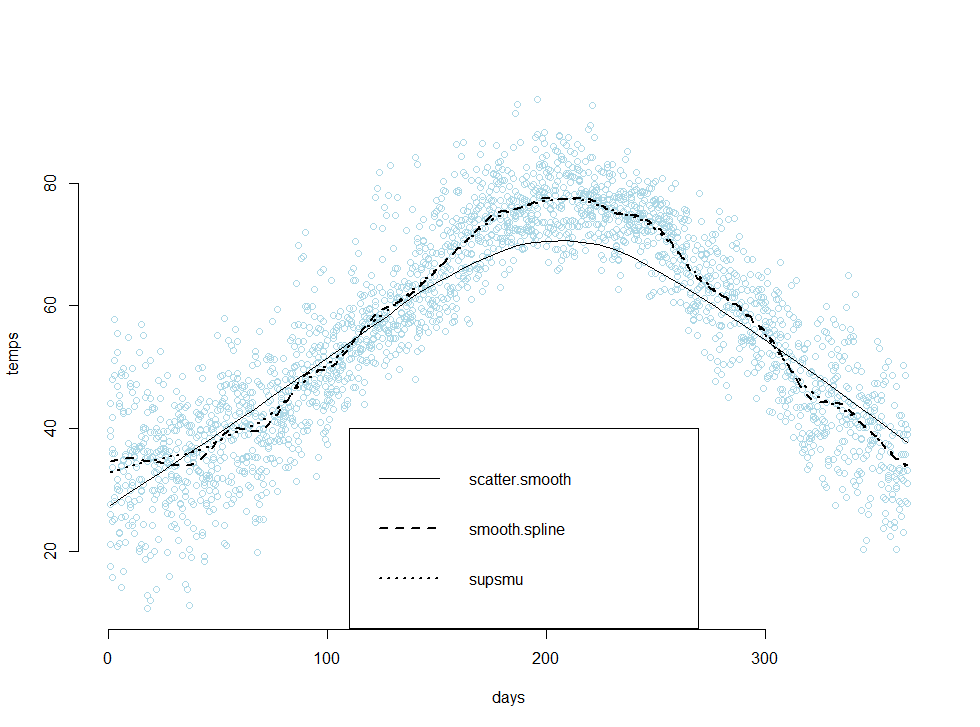
Sweave also has the capability to print graphics onto your PDF. The following example applies three different smoothing techniques to a dataset containing temperatures in New York City, and then plots the results in a scatter plot:
[code language=”R”]
documentclass{article}
usepackage{parskip}
begin{document}
SweaveOpts{concordance=TRUE}
Here’s a chart depicting three different smoothing techniques on a dataset. Below, you’ll see some R input, along with the resulting diagram:
<<fig=true>>=
library(‘UsingR’)
attach(five.yr.temperature)
scatter.smooth(temps~days,col=”light blue”,bty=”n”)
lines(smooth.spline(temps~days),lty=2,lwd=2)
lines(supsmu(days, temps),lty=3,lwd=2)
legend(x=110,y=40,lty=c(1,2,3),lwd=c(1,2,2),
legend=c(“scatter.smooth”,”smooth.spline”,”supsmu”))
detach(five.yr.temperature)
@
end{document}
[/code]
Pretty neat, right? I’d have to say that I’m extremely impressed with RStudio’s team, and their platform has made both R and LaTeX much more enjoyable for me to use. From the above examples, we can conclude that there are at least two benefits from using Sweave:
- There’s no need to save images, or copy and paste output into a separate file. Novice users of R would likely generate the R output in a separate instance of R, copy both the R input and output into a textfile, and then copy those pieces into a final report. This process is both time consuming and error prone.
- The R code is evaluated when the LaTeX document is compiled, and this means that both the R input and R output within the file report correspond to each other. This greatly reduces the frequency of errors, and increases the consistency of the code you see in the final report.
Because of this, I’ve found Sweave to be extremely useful on the job, especially in the documentation of code.
Additional Resources
The code examples that you see above use data provided from a book that I’m currently working through, Using R for Introductory Statistics. The book comes with its own package called ‘UsingR’ which contains several data sets that are used in its exercises. Sweave has an official instruction manual, which can be found on it’s official home page, here. I found the manual to be quite technical, and I believe it might also be difficult for people who are not thoroughly familiar with the workings of LaTeX. I believe the key to learning Sweave is to simply learn the noweb syntax and to experiment with adjusting the code-chunk options yourself.
noweb
An article on Sweave from RNews
A tutorial by Nicola Sartori
The Joy of Sweave by Mario Pineda-Krch
More links from UMN
An article from Revolution Analytics


