• Home
  • Readings
  • Github
  • MIES
  • TmVal
  • About
Gene Dan's Blog

Tag Archives: Vba

No. 80: Book Review – Excel & Access Integration

15 January, 2013 2:43 AM / Leave a Comment / Gene Dan

Hey everyone,

A couple months ago, I received a couple of Cyber Monday deals from O’Reilly and Apress offering 50% off all e-books. I couldn’t resist and I bought about 10 books, including a set of 5 called the “Data-Science Starter Kit” which includes tutorials on R and data analysis. One of the books I purchased was Alexander and Clark’s Excel & Access Integration, which covers basic connectivity between the two programs along with more advanced techniques such as VBA/SQL/ADO integration. Learning how to use the latter technique was the main reason I decided to purchase the book. We actuaries are well-versed in basic maths and finance, but when it comes to programming and database management, as a group we aren’t that strong. However, one of our strongest traits is being able to teach ourselves, and many of the most skilled programming actuaries I know are self-taught (actually, it is believed that most programmers in general are autodidacts).

Actuaries spend a good chunk of their time (possibly most) working with Excel and Access, and while most of them eventually become proficient with both softwares, very few become adept at integrating the two programs efficiently to make the best use of their time. Learning to do so takes a non-trivial investment of time and effort – first of all, being proficient with the interfaces of the two programs is a must. Second, the actuary must learn VBA to familiarize himself with the language’s objects, properties, and methods (and that’s if the actuary is already familiar with object-oriented programming). Third, the actuary must learn SQL to efficiently query tables. Finally, the actuary must learn ADO to simultaneously manipulate Excel and Access objects, and to be able to write SQL queries within the VBA environment.

To a junior actuary, this can be a daunting task. Not only must he keep up with the deadlines from his regular work, but he must also study mathematics for his credentialing exams. Fitting in additional IT coursework is a luxury. However, in my opinion it’s well worth the effort. By the time I purchased this book, I was on the 3rd step of the process I had mentioned earlier – I was learning SQL and slowly weaning myself away from the Design View in Access. I started reading the book at the beginning of this month and finished it last afternoon, and in timing myself I totaled about 21.5 hours over 374 pages. Here’s what I think:

Experts can skip to Chapter 8
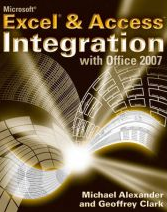
exacThe first 7 chapters cover basic integration techniques using the Excel and Access GUIs, mostly through the ribbons of each program. Some of these techniques involve linking tables and queries, along with creating reports and basic macros in Access. Chapter 7 gives a brief introduction to VBA, but doesn’t go as in-depth as Walkenbach’s text (which is over 1000 pages long). In my opinion, these chapters are good for those looking for a refresher in the basics, but novices should look elsewhere as these chapters might not be detailed enough to give a comprehensive review of Excel and Access. On the other hand, experts looking for a quick introduction on ADO might find the first 7 chapters trivial, and should be able to start on chapter 8 without any trouble if they have an upcoming deadline to meet.

Chapter 8 is where the book really shines. I view ADO as the “missing piece” that analysts need to integrate these two programs. The example subroutines provided with the included files are clear, easy to understand, and come with plenty of comments that explain how each step works. The macros are ready to run, and you can see how it’s possible to say, create a subroutine that can output 50 queries into a report with no human intervention.

The last two chapters focus on XML and integrating Excel and Access with other Microsoft applications such as Word, PowerPoint, and Outlook. I don’t use these programs heavily, but the examples were straightforward and understandable.

Some Caveats

Not all of the examples work. I found that one of the provided tables was missing a field that I needed to run an example using MSQuery. Furthermore, some details within the provided files were inconsistent with what I read in the text. For instance, some of the subroutine names were different, along with the names and extensions of some files. The last thing I didn’t like about the book was the overuse of some buzzwords. However, this book is hardly the worst offender I’ve seen, and overall I’d rate it as an excellent book and a invaluable reference for any actuary’s library.

Posted in: Logs / Tagged: Access, ADO, automation, DAO, Excel, Excel & Access Integration, Geoffrey Clark, Michael Alexander, ODBC, queries, SQL, VBA

No. 78: Project Euler #1

30 November, 2012 3:45 AM / 1 Comment / Gene Dan

Hey everyone,

I took a few weeks off posting in order to study for Exam MFE, which I took 4 weeks ago. I’m still waiting for the result, so in the meantime I’ve decided to knock out the CAS modules and finish up my SQL course before I have to start studying hard again. Anyway, I’ve finally gotten around to attempting the Project Euler problems that my friends, along with other actuaries, recommended to me as a good way to improve my programming skills.

Basically, Project Euler is a website that hosts mathematical problems that anyone can attempt to solve with whatever method they wish. Most of the problems are simply stated and can be understood by most people who have taken a basic course in number theory. However, they are often very computationally intensive if attempted directly so most people try to solve them by writing computer programs. Oftentimes students will use the site in an iterative fashion to practice their programming skills when picking up a new language. For example, one of my colleagues who has solved 80 problems first used the site to learn VBA, and then did the same problems again in R, and then again in C++.

For my first attempt, I decided to use VBA because I already know most of the basic syntax. Before starting, I decided that I would not seek any outside help or lookup any solutions when trying to solve these problems, because I want to work these out on my own. So please don’t give me any tips! (although I do appreciate any advice for any of my other projects).

The first problem is stated as follows:

If we list all the natural numbers below 10 that are multiples of 3 or 5, we get 3, 5, 6 and 9. The sum of these multiples is 23.

Find the sum of all the multiples of 3 or 5 below 1000.

Solution:

[code language=”vb”]
Sub euler1()

Dim x As Long ‘natural number to be tested
Dim y As Long ‘current sum of the multiples of 5 or 3

y = 0
For x = 1 To 999
If x Mod 3 = 0 Or x Mod 5 = 0 Then
y = y + x
End If
Next x

Debug.Print y

End Sub
[/code]

The final output is 233168. As you can see, the problem is quite easy to understand (and this one was very easy to solve as well) for anyone who passed grade school math. You can probably solve it by sitting at your desk and adding every multiple of 3 or 5 below 1000 by hand, but that would be extremely boring and you probably have better things to do. That’s why you write a program to solve the problem. The solution I wrote above is a simple brute force method (I tested every natural number below 1000 to see if it was evenly divided by 3 or 5) that took less than a second for my computer to solve. The key to understanding the solution is the mod operator, which returns the remainder in a division operation (for example 5 mod 3 equals 2). The statement “If x Mod 3 = 0 Or x Mod 5 = 0” tells the computer to execute the subsequent line, or to add x to the cumulative sum if either x mod 3 or x mod 5 equals 0, in other words, if the remainder after dividing x by 3 or 5 is 0.

So far I’ve solved 17 of the problems, mostly through brute force although I was able to solve one of them by hand. However, as the problems get progressively harder and more computationally intensive, brute force methods become less feasible and more creative thought is required. For example, problem 12 took my computer at least an hour to solve (I’m not sure how long it actually took because I left it on after I went to sleep). This means my solution wasn’t efficient, and that I ought to give it another shot (reduce the amount of iterative code, perhaps).
Posted in: Logs, Mathematics / Tagged: project euler, project euler #1, project euler vba, VBA

No. 77: Stochastic Calculus on a Friday Night

13 October, 2012 2:21 AM / Leave a Comment / Gene Dan

\[\int^a_b \mathrm{d}Z(t) = \lim_{n \to \infty} \sum^n_{i=1}\left(Z\left(\frac{ia}{n}\right)-Z\left(\frac{(i-1)a}{n}\right)\right) \]
Hey everyone,

I’m struggling to absorb all the material necessary to pass MFE, but if I can just plow through the 3 remaining chapters I think I’ll be OK. I keep telling myself not to freak out because everyone else says that the last quarter of MFE is notoriously difficult. You’re not expected to master the theoretical details of Brownian motion or Itô processes but you are expected to be able to understand the basics and be able to manipulate mathematical expressions to make meaningful calculations – such as pricing bonds and options – but even that can be intimidating, especially to those (like me) who haven’t taken a course on differential equations.

The figure above represents a stochastic integral – this is kind of like the type of integral you learned in elementary calculus except in this case the function Z(t) is not a fixed function – it is a function that returns a random value from a normal distribution whose parameters vary with respect to time. This particular integral calculates the movement of a stock price from time b to time a. Another thing we might want to model is the total variation of the process – which is the arc length of the stock price trajectory (we use the absolute value because we want down-moves, which are negative, to add to the arc length) :
\[ \lim_{n to \infty}\sum^n_{i=1}\left|X\left(\frac{iT}{n}\right)-X\left(\frac{(i-1)T}{n}\right)\right| \]
An interesting note is that as n approaches infinity, the probability the trajectory crosses its starting point an infinite number of times equals 1 (I have a hard time imagining this).

The image below is a visual representation of Brownian motion with different shades of blue representing a different number of steps. Note that this wouldn’t be appropriate for stock prices because ideally, we would want the trajectory to only traverse positive time and value:

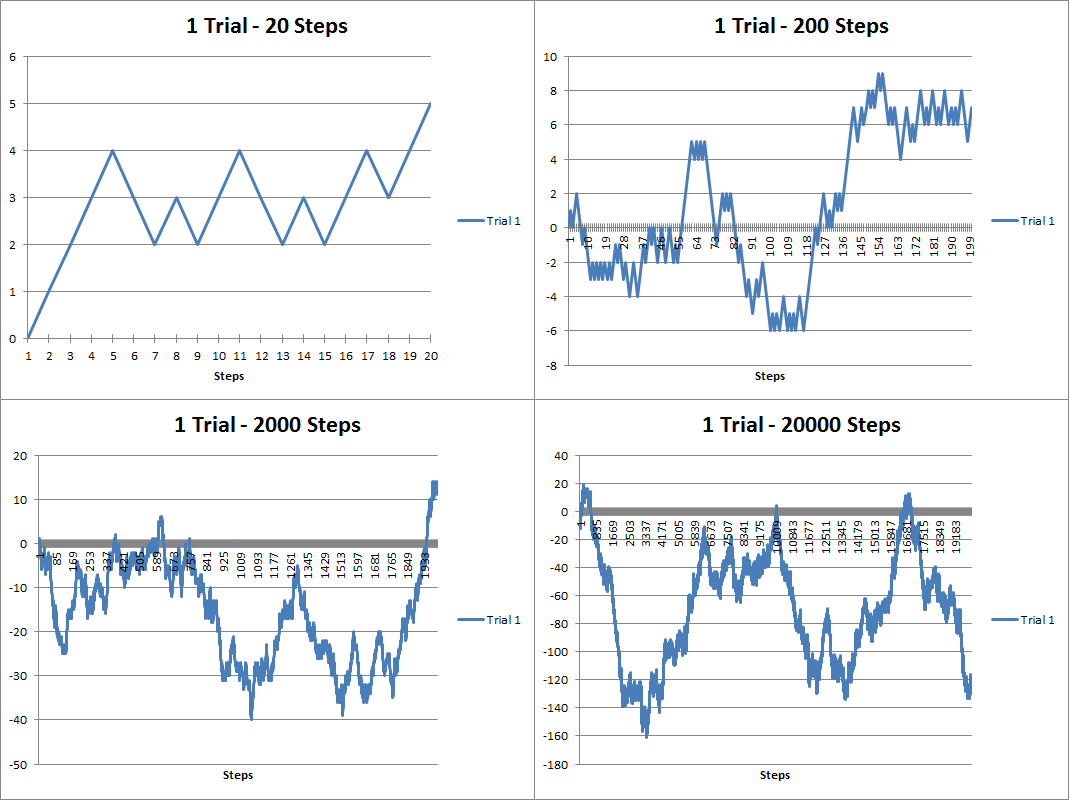
Anyway, over a year ago I dabbled with some discrete stochastic processes using VBA. Here are some random walks I generated:

The above figure are random walks generated using 20, 200, 2000 and 20000 steps. You can see that it looks kind of like a stock chart except the values can be negative. As the number of steps increases, the trajectory looks more like a curve. Brownian motion is when the number of steps becomes infinitely large and the time between steps infinitely small. Below you’ll see that I’ve overlapped several trials below. As the number of trials increases, you can see that the results take up more and more of the possible trajectory space:

About a year and a half ago I had created a youtube video showing how you can animate the random walks in VBA:

Here’s part of the source code I used to generate the walks:

[code language=”vb” wraplines=”TRUE” collapse=”TRUE”]

Sub randwalk()

Dim x As Double
Dim y As Long, z As Double, m As Integer, n As Integer, s As Integer
Dim randarray() As Double
Dim ymax As Integer
Dim ChtObj As ChartObject
Dim Steps As Double, Trials As Double
Dim stup As Double, stdown As Double
Dim pstup As Double, pstown As Double
Dim frate As Double

starttime = Timer

Application.ScreenUpdating = False

For Each ChtObj In Worksheets(“Graph”).ChartObjects
ChtObj.Delete
Next ChtObj

Worksheets(“Data”).UsedRange.Clear

Steps = Range(“STEPS”).Value
Trials = Range(“TRIALS”).Value
stup = Range(“STUP”).Value
stdown = Range(“STDOWN”).Value
pstup = Range(“PSTUP”).Value
frate = Range(“FRATE”).Value

ReDim randarray(0 To Steps) As Double

For m = 0 To Trials – 1
z = Range(“STARTVAL”).Value
randarray(0) = Range(“STARTVAL”).Value
For y = 1 To Steps
x = Rnd()
If x >= (1 – pstup) Then x = stup Else x = -1 * stdown
If Range(“FTYPE”).Value = “Arithmetic” Then
z = z + x
Else
z = z * (1 + x)
End If
randarray(y) = z
Next y
Worksheets(“Data”).Range(“A1”).Offset(0, m).Value = “Trial ” & m + 1
Worksheets(“Data”).Range(“A2:A” & Steps + 1).Offset(0, m) = WorksheetFunction.Transpose(randarray)
Next m

If Range(“COMP”).Value = “Yes” Then
For n = 1 To Steps
randarray(n) = randarray(n – 1) * (1 + frate)
Next n

Worksheets(“Data”).Range(“A1:A” & Steps + 1).Offset(0, Trials) = WorksheetFunction.Transpose(randarray)
End If

Dim MyChart As Chart
Dim DataRange As Range
Set DataRange = Worksheets(“Data”).UsedRange
Set MyChart = Worksheets(“Graph”).Shapes.AddChart.Chart
MyChart.SetSourceData Source:=DataRange
MyChart.ChartType = xlLine

With Worksheets(“Graph”).ChartObjects(1)
.Left = 1
.Top = 1
.Width = 400
.Height = 300
.Chart.HasTitle = True
If Trials = 1 Then
.Chart.ChartTitle.Text = Trials & ” Trial – ” & Range(“FTYPE”).Value & ” Progression”
Else
.Chart.ChartTitle.Text = Trials & ” Trials – ” & Range(“FTYPE”).Value & ” Progression”
End If
.Chart.PlotBy = xlColumns

End With

With MyChart.Axes(xlCategory)
.MajorTickMark = xlTickMarkCross
.AxisBetweenCategories = False
.HasTitle = True
.AxisTitle.Text = “Steps”
End With

For s = 1 To Trials
MyChart.SeriesCollection(s).Name = “Trial ” & s
Next s

If Range(“COMP”).Value = “Yes” Then
MyChart.SeriesCollection(Trials + 1).Name = “Fixed Growth”
MyChart.SeriesCollection(Trials + 1).Interior.Color = “black”
End If

Range(“MAXVAL”).Value = WorksheetFunction.Max(Worksheets(“Data”).UsedRange)
Range(“MINVAL”).Value = WorksheetFunction.Min(Worksheets(“Data”).UsedRange)
Range(“EXECTIME”).Value = Format(Timer – starttime, “00.000”)

Application.ScreenUpdating = True

End Sub
[/code]

Posted in: Logs / Tagged: Actuarial Exams, brownian motion, exam MFE, random walks, stochastic calculus, stochastic processes, VBA

Archives

  • September 2023
  • February 2023
  • January 2023
  • October 2022
  • March 2022
  • February 2022
  • December 2021
  • July 2020
  • June 2020
  • May 2020
  • May 2019
  • April 2019
  • November 2018
  • September 2018
  • August 2018
  • December 2017
  • July 2017
  • March 2017
  • November 2016
  • December 2014
  • November 2014
  • October 2014
  • August 2014
  • July 2014
  • June 2014
  • February 2014
  • December 2013
  • October 2013
  • August 2013
  • July 2013
  • June 2013
  • March 2013
  • January 2013
  • November 2012
  • October 2012
  • September 2012
  • August 2012
  • July 2012
  • June 2012
  • May 2012
  • April 2012
  • March 2012
  • February 2012
  • January 2012
  • December 2011
  • September 2011
  • August 2011
  • July 2011
  • June 2011
  • January 2011
  • December 2010
  • October 2010
  • September 2010
  • August 2010
  • June 2010
  • May 2010
  • April 2010
  • March 2010
  • September 2009
  • August 2009
  • May 2009
  • December 2008

Categories

  • Actuarial
  • Cycling
  • Logs
  • Mathematics
  • MIES
  • Music
  • Uncategorized

Links

Cyclingnews
Jason Lee
Knitted Together
Megan Turley
Shama Cycles
Shama Cycles Blog
South Central Collegiate Cycling Conference
Texas Bicycle Racing Association
Texbiker.net
Tiffany Chan
USA Cycling
VeloNews

Texas Cycling

Cameron Lindsay
Jacob Dodson
Ken Day
Texas Cycling
Texas Cycling Blog
Whitney Schultz
© Copyright 2025 - Gene Dan's Blog
Infinity Theme by DesignCoral / WordPress