• Home
  • Readings
  • Github
  • MIES
  • TmVal
  • About
Gene Dan's Blog

Tag Archives: Vector Plot Sage

No. 92: Vector Addition in SAGE

22 July, 2013 8:03 PM / 1 Comment / Gene Dan

Today I’d like to introduce you to some simple examples of vector addition in SAGE. I have been reading Lang’s introductory text to linear algebra, the first chapter of which covers properties of vectors.

SAGE can be used alongside Lang’s text as a gentle introduction to computer algebra systems. In my experience, I’ve found that bridging the gap between computer and paper mathematics can be intimidating, especially if a mathematics student doesn’t have a background in computer programming.

I’ve previously outlined why I think SAGE is an ideal educational tool, but to rehash it’s mainly because SAGE is open source and it uses Python as the language to execute commands. The open source nature of the software allows the student to examine what exactly is going on behind the user interface, and Python is a high-level programming language that lets the student execute commands right away without getting bogged down with low-level details like computer memory management.

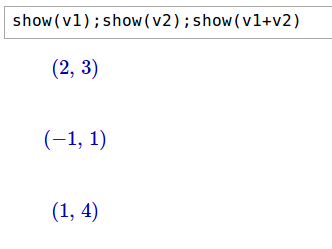
To get started, I’ll declare and print two vectors in SAGE, v1 and v2:

wp_92-1

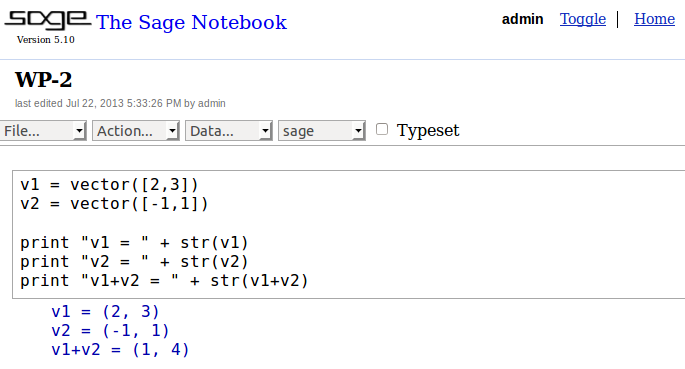
The first two lines in the above example declare the two vectors as variables, and the last three lines print v1, v2, and their sum in the output. Declaration of variables and the print function should be familiar to Python users.

We can also use SAGE to display the vectors in prettyprint, which means to display the vectors in a manner similar to what you’d see in a publication:

wp_92-2

Furthermore the latex() function outputs the LaTeX code – which is what you’d use to typeset such a publication:

wp_92-3In this case you would type \left(2,\,3\right) in your LaTeX editor.

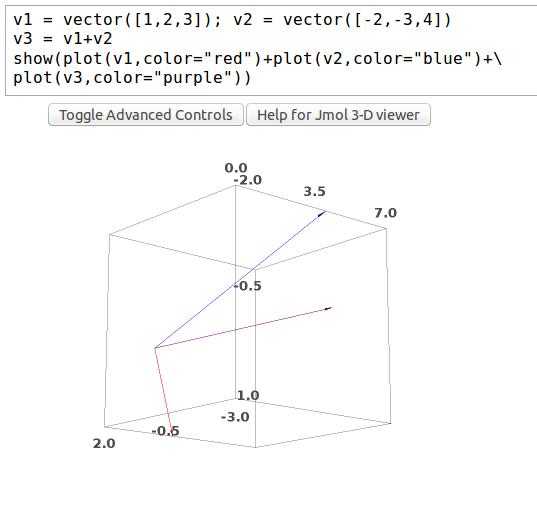
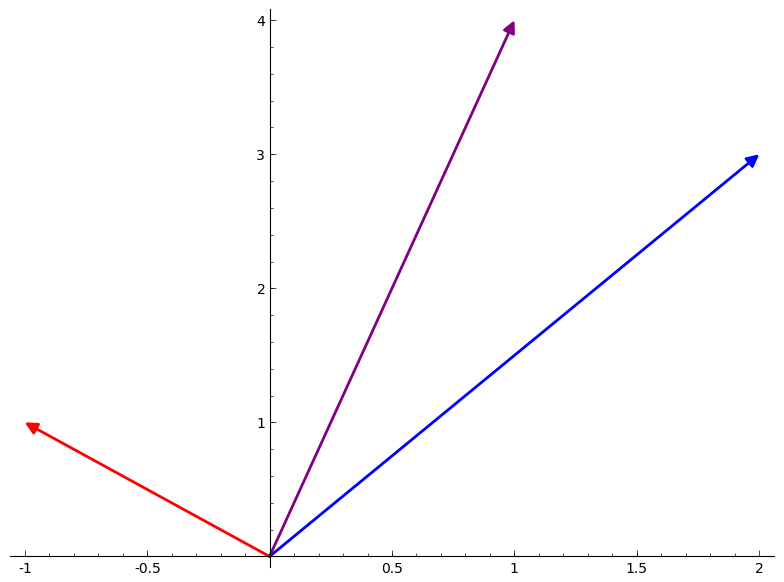
In the following diagram, you can see that each vector can be represented as a point on a two-dimensional plane. v1 and v2 are represented in blue and red, respectively, and their sum, v1+v2, in purple:

[code language=”python”]
show(plot(v1,color=”blue”)+plot(v2,color=”red”)+plot(v1+v2,color=”purple”))
[/code]

wp_92-4

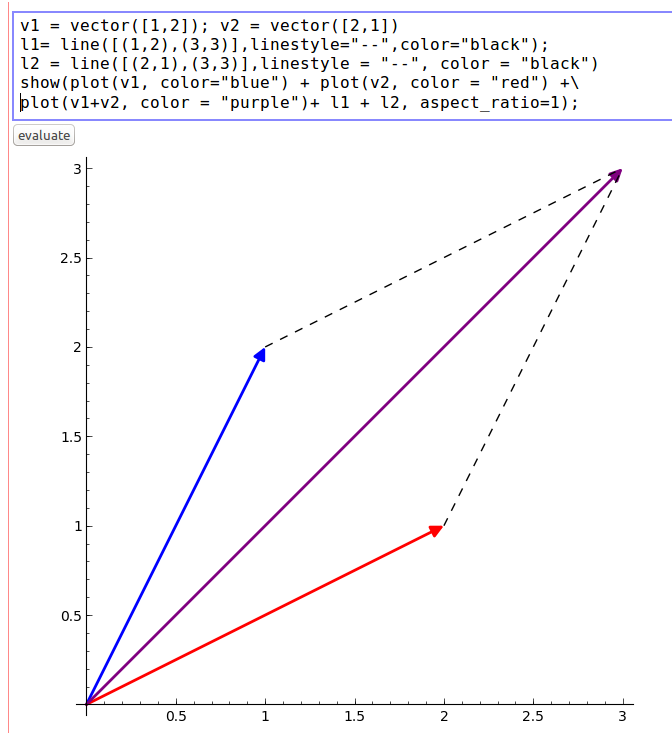
We can now use SAGE’s plotting capabilities to depict the Parallelogram Rule for vector addition, which states that the sum of two vectors can be represented as the fourth vertex of the parallelogram whose other three vertices are the two component vectors and the origin:

[code language=”python”]
l1=line([[1,4],[2,3]],linestyle=”–“,color=”black”)
l2=line([[-1,1],[1,4]],linestyle=”–“,color=”black”)
show(plot(v1,color=”blue”)+plot(v2,color=”red”)+plot(v1+v2,color=”purple”)+plot(l1)+plot(l2))
[/code]

wp_92-5
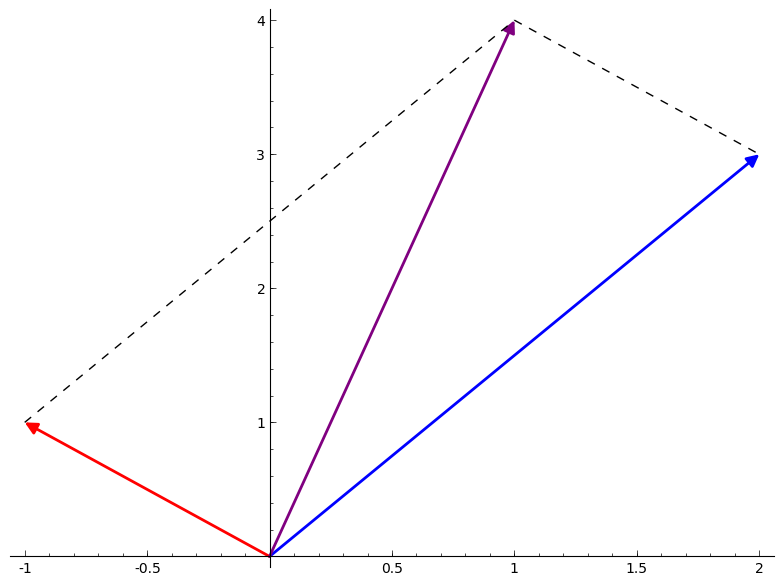
Here, I have declared two additional variables as dashed line segments, and added them to the plot to complete the parallelogram.

SAGE also lets you declare and plot polygons. In the example below I have declared two polygons, p1 and p2, and shaded them in violet blue and violet red, respectively:

[code language=”python”]
p1 = polygon([(0,0),(1,4),(2,3)],rgbcolor=(138/256,43/256,226/256))
p2 = polygon([(-1,1),(0,0),(1,4)],rgbcolor=(219/256,112/256,147/256))
show(plot(v1,color=”blue”)+plot(v2,color=”red”)+plot(v1+v2,color=”purple”)+plot(l1)+plot(l2)+plot(p1)+plot(p2))
[/code]

wp_92-6
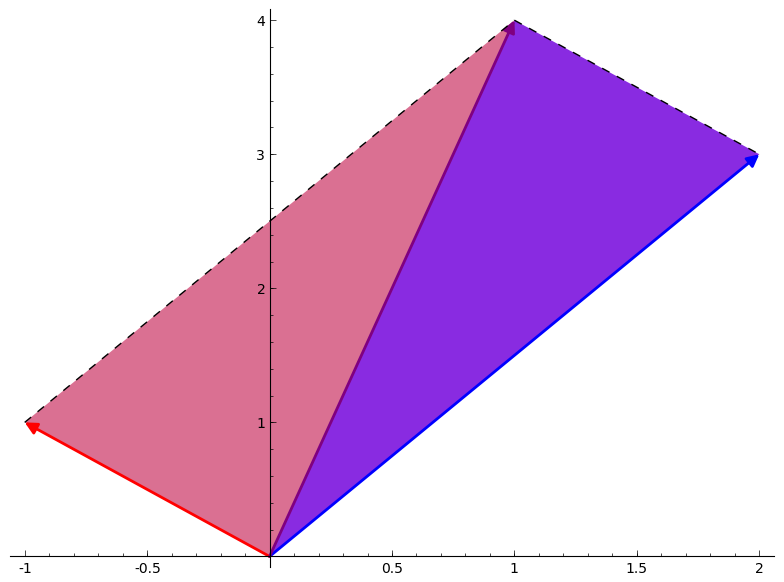
As you can see, the parallelogram can be depicted as two triangles of equal size.

That’s it for today. I’ll soon follow up with another post on vector multiplication, and maybe some more properties such as equivalence and parallelism.

Posted in: Logs, Mathematics / Tagged: python, SAGE, sage LaTeX, SAGE linear algebra, sagemath, vector addition sage, vector plot sage

No. 91: Learning Linear Algebra

15 July, 2013 8:44 PM / 1 Comment / Gene Dan

I started learning linear algebra a couple weeks ago. I’m taking a three-pronged approach to study:

Linear Algebra – David Lay

Lay’s book isn’t very heavy on theory and mostly covers matrix computations. I took an introductory course in Linear Algebra over a five-week period back in 2007, so I’ve already done most of the problems in this book. However, since the course was so short, naturally cramming was involved as I scrambled to cover the entire textbook in a little more than a month – so with respect to this I didn’t benefit from the spacing effect to commit the things I learned into long-term memory. I think a review would be helpful since my current job duties demand that I understand matrices well.

Introduction to Linear Algebra – Serge Lang

Serge Lang wrote an introductory text that is a little bit more theoretically rigorous than Lay’s book. This reading is pretty short at 280 pages, and contains a modest number of problems (328). I’m reading this mostly at a pretty slow pace (4 pages a day), so I should be done in about 2 months. This mainly serves as a supplementary text to Lay.

Sage

I wrote about Sage a couple years ago, and I’m finally putting it to use to help myself learn linear algebra. Sage is an open-source project aimed at creating a free, viable alternative to proprietary computer algebra systems such as Mathematica, Matlab, and Maple. I’m starting out by reading the Sage Tutorial and applying the built-in commands to the problems from Lay’s book. For example, here is a screenshot of the Sage Notebook:

SageNb

Here, you can see three cells of code along with output for each one. The first cell contains two commands, one to declare a matrix A, and another to show it:

\[A=\left[ \begin{array}{rrrr} 1 & 7 & 3 & -4\\0 & 1 & -2 & 3 \\0 & 0 & 0 & 1 \\ 0 & 0 & 1 & -2 \end{array} \right] \]

The second cell declares and prints matrix B:

\[B=\left[ \begin{array}{rrrr} 1 & -4 & 9 & 0\\0 & 1 & 7 & 0\\0 & 0 & 2 & 0\\0 & 3 & 1 & 6 \end{array} \right] \]

The third cell adds the two matrices together:

\[A+B=\left[ \begin{array}{rrrr} 1 & 7 & 3 & -4\\0 & 1 & -2 & 3 \\0 & 0 & 0 & 1 \\ 0 & 0 & 1 & -2 \end{array} \right]+\left[ \begin{array}{rrrr} 1 & -4 & 9 & 0\\0 & 1 & 7 & 0\\0 & 0 & 2 & 0\\0 & 3 & 1 & 6 \end{array} \right]=\left[ \begin{array}{rrrr} 2 & 3 & 12 & -4\\0 & 2 & 5 & 3\\0 & 0 & 2 & 1\\0 & 3 & 2 & 4 \end{array} \right]\]

Vector Addition

I really like Sage’s plotting capabilities. The following example declares two vectors, v1 and v2, and plots their sum, which is also a vector. v1 is blue, v2 is red, and the vector sum is purple:

SageNb4


I added some dashed lines (which are declared as l1 and l2 in the cell) to complete the parallelogram in the plot. This shows that the sum of two vectors can be represented as the fourth vertex of the parallelogram where the other three vertices are its component vectors and the origin.

Sage also has 3D plotting capabilities. The following example shows the sum of two vectors in three-space along with its components:

SageNb5

Posted in: Logs, Mathematics / Tagged: david lay linear algebra, introduction to linear algebra, linear algebra, sagemath, serge lang, vector plot sage

Archives

  • September 2023
  • February 2023
  • January 2023
  • October 2022
  • March 2022
  • February 2022
  • December 2021
  • July 2020
  • June 2020
  • May 2020
  • May 2019
  • April 2019
  • November 2018
  • September 2018
  • August 2018
  • December 2017
  • July 2017
  • March 2017
  • November 2016
  • December 2014
  • November 2014
  • October 2014
  • August 2014
  • July 2014
  • June 2014
  • February 2014
  • December 2013
  • October 2013
  • August 2013
  • July 2013
  • June 2013
  • March 2013
  • January 2013
  • November 2012
  • October 2012
  • September 2012
  • August 2012
  • July 2012
  • June 2012
  • May 2012
  • April 2012
  • March 2012
  • February 2012
  • January 2012
  • December 2011
  • September 2011
  • August 2011
  • July 2011
  • June 2011
  • January 2011
  • December 2010
  • October 2010
  • September 2010
  • August 2010
  • June 2010
  • May 2010
  • April 2010
  • March 2010
  • September 2009
  • August 2009
  • May 2009
  • December 2008

Categories

  • Actuarial
  • Cycling
  • Logs
  • Mathematics
  • MIES
  • Music
  • Uncategorized

Links

Cyclingnews
Jason Lee
Knitted Together
Megan Turley
Shama Cycles
Shama Cycles Blog
South Central Collegiate Cycling Conference
Texas Bicycle Racing Association
Texbiker.net
Tiffany Chan
USA Cycling
VeloNews

Texas Cycling

Cameron Lindsay
Jacob Dodson
Ken Day
Texas Cycling
Texas Cycling Blog
Whitney Schultz
© Copyright 2025 - Gene Dan's Blog
Infinity Theme by DesignCoral / WordPress